(ZH) Tanker Rates Turn Negative For First-Time Ever As US LNG Flocks To Europe

Tanker Rates Turn Negative For First-Time Ever As US LNG Flocks To Europe

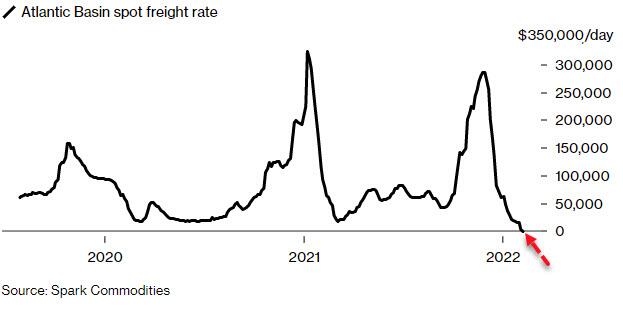
The spot charter rates for shipping U.S. liquefied natural gas to Europe have just turned negative, suggesting that there are now too many LNG vessels in the Atlantic region but fewer requirements, according to LNG freight price assessor Spark Commodities.
In December and January, dozens of cargoes of U.S. LNG flocked to Europe, which had a record-high natural gas price amid the gas and energy crisis. The crisis pushed regional LNG prices way above the Asian LNG benchmark and 14 times higher than the U.S. Henry Hub price. Tankers were not only traveling between the U.S. and Europe, but many were also diverted away from Asia to Europe as spot sellers took advantage of the higher gas prices in Europe.
As the number of available LNG tankers in the Atlantic basin surged, freight rates plummeted. On Tuesday, Spark Commodities assessed its first-ever negative spot LNG freight rate at -$750/day for the Spark30S Atlantic assessment.
The negative freight rate “Highlights how current vessel charter payments do not cover the fuel cost of ballasting the vessel back to load port. Lots of ships and few requirements,” Spark Commodities noted.
Last week, LNG freight rates continued to slide on the back of weak vessel demand and increasing availability in both the Atlantic and Asia Pacific basins, according to Spark Commodities.
“There just aren’t enough charter requirements to keep these ships fully utilized,” Tim Mendelssohn, managing director of Spark, told Bloomberg on Tuesday, commenting on the negative rates for Europe.
The recent slide in LNG tanker rates is a dramatic shift from late last year when freight rates reached an all-time high with Asia stocking up for the winter and Europe desperate for any gas supply in the crisis.
Now the soaring European imports from the U.S. have sent spot freight rates below zero.
Europe was the top destination for U.S. LNG exports in January, for a second month running, ahead of Asia, according to Refinitiv data cited by Reuters last week. Roughly two-thirds of U.S. LNG exports traveled to Europe last month after 61 percent of American LNG shipments went to Europe in December.

(ZH) Pfizer Quietly Adds Language Warning That 'Unfavorable Pre-Clinical, Clinic

Pfizer Quietly Adds Language Warning That 'Unfavorable Pre-Clinical, Clinical Or Safety Data' May Impact Business

Two weeks ago, the FDA begged a Texas judge to delay production on the first monthly batch of 55,000 pages of Covid-19 vaccine data submitted to the agency by Pfizer. Originally, the agency was set to produce just 500 pages-per-month.
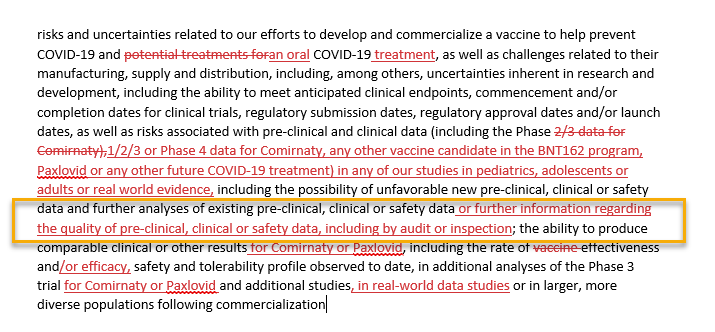
Now, Pfizer - which just forecast $54 billion in Covid-related sales in 2022, appears to be anticipating some bad news, as evidenced by several redline changes in their Q4 earnings releases.
As Rubicon Capital's Kelly Brown notes on Twitter, the changes center around disclosures of unfavorable safety data.
For example, in Q4 they added: "or further information regarding the quality of pre-clinical, clinical or safety data, including by audit or inspection."
More from Brown, who notes that Pfizer is now highlighting "concerns about clinical data integrity..."
The company also notes that Covid-19 may "diminish in severity or prevalence, or disappear entirely."
What's behind the curtain, Pfizer?

FT : Emerging markets signal end to aggressive rate-raising cycles

Emerging markets signal end to aggressive rate-raising cycles
Brazil, Russia and others jumped ahead of the Fed to control inflation but may have stifled growth

As the Federal Reserve prepares to start raising interest rates as soon as next month, leading emerging economies such as Brazil and Russia are so far ahead of the US central bank they could be nearing the end of the rate-raising cycles they embarked on last year.

It is an unusual situation for emerging market central banks, which typically follow the Fed’s lead. But the danger posed by sharp increases in consumer price inflation prompted some policymakers to act early and aggressively — so much so, analysts warn, that high interest rates at a time of slow growth and high debt levels are jeopardising their recovery from the coronavirus crisis.

“Hiking early was the right decision for most emerging market central bankers to make,” said Adam Wolfe, EM economist at Absolute Strategy Research, a consultancy in London.

But he warned some monetary policymakers might have overreacted to temporary factors such as supply chain disruption and rising food prices, slamming the brakes on growth while economies were still in need of stimulus.

In Brazil, Wolfe noted, short-term market lending rates rose above long-term rates at the end of last year, often a sign of a coming recession. “It’s easy to make the case that that’s the direction Brazil is headed.”


Brazil’s central bank began tightening in March last year when its rate was 2 per cent. Last week, after eight steps up, it reached 10.75 per cent. A survey of local economists has predicted rates will peak at 12 per cent in May before paring back to 11.75 per cent in December. The same survey showed economic growth slowing to just 0.3 per cent this year, from an estimated 4.7 per cent in 2021.

Brazil is far from alone. The Czech Republic increased its rate to 4.5 per cent last week — a steep rise from 0.25 per cent when tightening began last June. The central bank said the rate would peak at about 5 per cent this spring.

Russia has doubled its policy rate to 8.5 per cent over the past year and expects to complete its cycle in the coming months. Chile’s rate went from 0.5 per cent in July to 5.5 per cent last month and is expected to peak at 7.5 per cent by mid-year.

Not counting Zimbabwe, which raised its policy rate 25 percentage points to 60 per cent in 2021, 33 developing countries have raised rates since the start of last year by a combined total of 84.55 percentage points, according to the website Central Bank News. Among wealthy countries, only Iceland, New Zealand, Norway and the UK have raised rates in the same period, by a combined 2.65 points.

EM central banks have got ahead of the Fed before, and it has tended to end badly. They were raising rates as the 2008-09 financial crisis neared, and before the 2011 eurozone currency crisis and the 2013 “taper tantrum” — the unexpected tightening of Fed policy that led to a heavy sell-off across EM stock and bond markets.

This time round, the Fed has signalled well in advance its intention to tighten policy not only by raising rates but by ending and then reversing its bond-buying programme. Better communication, analysts say, makes a repeat of the taper tantrum unlikely.

But EM policymakers have much more to worry about. The pandemic is far from over. In many countries, debts have risen beyond sustainable levels, threatening a wave of defaults. The difference between the rate of growth in emerging and developed economies — the justification for investing in EM assets — has fallen to its lowest level this century. High and rising interest rates will put an additional brake on growth.

Nevertheless, policymakers may have done well to take their medicine today rather than postponing it for tomorrow. “If you let inflation get out of control, the consequences [for economic growth] will be far worse,” said Peter West, economic adviser to EM Funding, a boutique advisory company in London.

This is especially true in Latin America and beyond, where memories of high and even hyperinflation mean rising prices can quickly feed into an escalation of inflation expectations, setting off a spiral of wage and price increases. The danger is acute in places such as Argentina and Chile, which still use index mechanisms to link financial contracts and wages to inflation.

Not all emerging economies have needed to control inflation. In many countries in Asia — in part because the price of rice, the staple food, has advanced much less than the price of wheat, the staple elsewhere — inflation is low and central banks have held firm. Indonesia cut its policy rate 0.25 points to 3.5 per cent a year ago. Malaysia cut the same amount to 1.75 per cent in July 2020, as did the Philippines to 2 per cent in November that year.

For those that have raised rates aggressively, there may even be some short-term pay-off. Foreign investors fled EM stocks and bonds last year as the risks of high inflation and stagnating growth outweighed the gains from higher interest rates. This year, as Brazil nears the end of its tightening cycle, its stock market has been among the world’s best performers as investors return.

The threat for these countries is that investors may soon turn their attention back to weaknesses in the real economy.

“I don’t see many undertaking the type of structural reforms that would unlock the potential for faster growth,” said Wolfe, the EM economist. “The outlook is really unclear.”

>>> US After Hours Summary: ENPH +15.7%, DOCS +8.3%, PAYC +7.5%, CMG +6.5% up sh

After Hours Summary: ENPH +15.7%, DOCS +8.3%, PAYC +7.5%, CMG +6.5% up sharply on earnings; NCR +9.7% on earnings and strategic alternatives; NEWR -21.9%, TCS -20.8%, USNA -7.3%, LYFT -4.1% lower on earnings

After Hours Gainers:

Companies trading higher in after hours in reaction to earnings/guidance: ENPH +15.7%, NCR +9.7% (co also exploring strategic alternatives), DOCS +8.3% (also acquires Amion), SCSC +8.2%, PAYC +7.5%, HUBG +7%, CMG +6.5% (also increases goal to get to 7,000+ restaurants in North America; accelerates unit growth forecast), CNO +5.5%, OMC +5.1%, XPO +4.8%, IIIV +4.6%, JKHY +3.8%, XPO +3.8%, MODN +3.5%, GFS +2.5%, MNDT +2.1% (also announces new strategic alliance with SentinelOne), FLT +1.4%, TSE +1.3%, ONTO +1.1%, DEI +1%, CCK +0.6%, VOYA +0.5%, ESE +0.1%, LBRT +0.1%, NBR +0.1%

Companies trading higher in after hours in reaction to news: SEDG +6.7% (in sympathy with strong ENPH earnings), RUN +4.2% (in sympathy with strong ENPH earnings), FSLR +3.5% (in sympathy with strong ENPH earnings), AJRD +3.4% (announces successful building and testing of Stored Chemical Energy Propulsion), FUBO +0.8% (announces market access agreement with Cleveland Cavaliers), BHC +0.7% (Solta Medical unit files for IPO), S +0.3% (new strategic alliance with MNDT), ESTC +0.2% (in sympathy with weak NEWR earnings), LUV +0.1% (reaches deal with union), GES +0.1% (issues statement in response to letter from Legion Partners), NFLX +0.1% (ticks higher after performing well with Oscar nominations), MMM +0.1% (increases dividend)

After Hours Losers:

Companies trading lower in after hours in reaction to earnings/guidance: NEWR -21.9%, TCS -20.8%, ATGE -17.8%, QNST -13.6%, VREX -12.5%, USNA -7.3%, ICHR -6.4%, CMP -5.9%, CRSR -4.9%, LYFT -4.1%, DCPH -3.8%, YUMC -2.6%, ATO -2.5% (also increases dividend), FMC -2.1% (also authorizes new $1 bln share repurchase program), APPS -2%, EGP -0.1%, PEAK -0.1%

Companies trading lower in after hours in reaction to news: ARGO -3.9% (expects net adverse prior year reserve), SPLK -2.5% (in sympathy with weak NEWR earnings), DDOG -1.5% (in sympathy with weak NEWR earnings), MAS -1.4% (files mixed securities shelf offering), UBER -1.1% (in sympathy with LYFT earnings), AUY -0.5% (reports updated mineral reserves), DT -0.4% (in sympathy with weak NEWR earnings), INCY -0.3% (stock offering), IIVI -0.2% (ships 400G ZR+ QSFP-DD-DCO transceivers to Windstream for field qualification), CNS -0.1% (reports January AUM), CMI -0.1% (files mixed securities shelf offering)

>>> US Close Dow +1,06% S&P +0,84% Nasdaq +1,28% Russell +1,63% VIX 21,44 -6,21%

Closing Stock Market Summary

The S&P 500 gained 0.8% on Tuesday, as the market drifted higher while investors digested another increase in interest rates and individual storylines. The Dow Jones Industrial Average (+1.1%), Nasdaq Composite (+1.3%), and Russell 2000 (+1.6%) each outperformed the benchmark index. 

Eight of the 11 S&P 500 sectors closed higher, including five that gained at least 1.0%. The materials sector (+1.6%) was the top-performer, and the heavily-weighted information technology sector (+1.3%) wasn't too far behind.

The energy sector (-2.1%), on the other hand, declined 2% as oil prices fell below $90 per barrel ($89.43, -1.84, -2.0%) amid speculation that the U.S. could allow Iran to increase its oil exports. Reports indicated that U.S.-Iran nuclear talks have made progress. 

Regarding interest rates, the 10-yr yield came within three basis points of the 2.00% level before setting at 1.95%, or four basis points above yesterday's settlement. The 2-yr yield rose five basis points to 1.34% amid lingering expectations for five rate hikes this year. The U.S. Dollar Index increased 0.2% to 95.60. 

Encouragingly, the higher rates benefited the financials sector (+1.4%) without hurting the growth stocks. The Russell 3000 Growth Index rose 1.1%, besting the 0.7% gain in the Russell 3000 Value Index. For what it's worth, the S&P 500 closed essentially at yesterday's high (4521.86). 

Amgen (AMGN 241.01, +17.48, +7.8%), meanwhile, rose 8% after the Dow component reported better-than-expected earnings results along with encouraging EPS guidance. Pfizer (PFE 51.70, -1.51, -2.8%) fell 3% after issuing disappointing full-year guidance. 

Peloton (PTON 37.27, +7.52, +25.3%) also reported downside guidance in addition to below-consensus fiscal Q2 results, but shares jumped 25% after the company announced a CEO change and cost-cutting measures. Shareholders were hopeful that the company could turn itself around or at least put itself in a more valuable position for a takeover. 

In M&A news, Mandiant (MNDT 17.75, +2.69, +17.9%) spiked 18% after Bloomberg reported that Microsoft (MSFT 304.56, +3.61, +1.2%) might bid for the company. NVIDIA (NVDA 251.08, +3.80, +1.5%) officially terminated its acquisition of Arm Holdings.

Reviewing Tuesday's economic data:

  • The December Trade Balance Report showed a widening in the trade deficit to $80.7 billion (consensus -$79.6 billion) from an upwardly revised $79.3 billion (from -$80.2 billion) in November. December exports were $3.4 billion more than November exports while December imports were $4.8 million more than November imports.
    • The key takeaway from the report is that the Omicron variant didn't seriously disrupt trade activity in December, although there were signs of a slowdown in China as U.S. goods exports there decreased by $2.2 billion.
  • The NFIB Small Business Optimism Index for January decreased to 97.1 from 98.9 in December.

Looking ahead, investors will receive Wholesale Inventories for December and the weekly MBA Mortgage Applications Index on Wednesday. 

  • Dow Jones Industrial Average -2.4% YTD
  • S&P 500 -5.1% YTD
  • Russell 2000 -8.9% YTD
  • Nasdaq Composite -9.3% YTD

CNBC : TikTok shares your data more than any other social media app — and it’s u

TikTok shares your data more than any other social media app — and it’s unclear where it goes, study says

Two of your social media apps could be collecting a lot of data on you — and you might not like what they’re doing with it.
That’s according to a recent study, published last month by mobile marketing company URL Genius, which found that YouTube and TikTok track users’ personal data more than any other social media apps.

The study found that YouTube, which is owned by Google, mostly collects your personal data for its own purposes — like tracking your online search history, or even your location, to serve you relevant ads. But TikTok, which is owned by Chinese tech giant ByteDance, mostly allows third-party trackers to collect your data — and from there, it’s hard to say what happens with it.
With third-party trackers, it’s essentially impossible to know who’s tracking your data or what information they’re collecting, from which posts you interact with — and how long you spend on each one — to your physical location and any other personal information you share with the app.
As the study noted, third-party trackers can track your activity on other sites even after you leave the app.

8:01
Inside a travel influencer’s $44,000 condo in Detroit, MI
To conduct the study, URL Genius used the Record App Activity feature from Apple’s iOS to count how many different domains track a user’s activity across 10 different social media apps — YouTube, TikTok, Twitter, Telegram, LinkedIn, Instagram, Facebook, Snapchat, Messenger and Whatsapp — over the course of one visit, before you even log into your account.
YouTube and TikTok topped the other apps with 14 network contacts apiece, significantly higher than the study’s average number of six network contacts per app. Those numbers are all probably higher for users who are logged into accounts on those apps, the study noted.

Ten of YouTube’s trackers were first-party network contacts, meaning the platform was tracking user activity for its own purposes. Four of the contacts were from third-party domains, meaning the social platform was allowing a handful of mystery outside parties to collect information and track user activity.
For TikTok, the results were even more mysterious: 13 of the 14 network contacts on the popular social media app were from third parties. The third-party tracking still happened even when users didn’t opt into allowing tracking in each app’s settings, according to the study.
“Consumers are currently unable to see what data is shared with third-party networks, or how their data will be used,” the report’s authors wrote.
In October, Wired published a guide to how TikTok tracks user data, including your location, search history, IP address, the videos you watch and how long you spend watching them. According to that guide, TikTok can “infer” personal characteristics from your age range to your gender based on the other information it collects. Google and other sites do the same thing, a practice called “inferred demographics.”
TikTok has been the subject of criticism in the past over how the company collects and uses data, especially from younger users, including claims that the company has transferred some private user data to Chinese servers.
As CNBC noted last year, TikTok’s privacy policy states that the app can share user data with its Chinese parent company, though it claims to employ security measures to “safeguard sensitive user data.”
In 2020, then-President Donald Trump looked to ban TikTok in the U.S. over concerns about the app’s data security policies, before current President Joe Biden walked back those threats and ordered a review of potential security threats posed by foreign-owned apps.
Neither TikTok nor YouTube immediately responded to CNBC Make It’s request for comment.

Science Insider : Vitamin D could be a piece of COVID-19's 'complex puzzle,' Isr

Vitamin D could be a piece of COVID-19's 'complex puzzle,' Israeli scientists say, after a new study finds a link between deficiency and severe illness

  • Low levels of vitamin D prior to catching COVID-19 were linked to worse illness, a study found.
  • Vitamin D helps bolster the immune system to tackle viruses that attack the lungs, researchers said.
  • Vitamin D is "one piece of the complex puzzle" underlying severe COVID-19, the scientists cautioned.

(ZH) A 50% Decline Will Only Be A Correction

A 50% Decline Will Only Be A Correction

A 50-percent decline will only be a correction and not a bear market.
I know. Right now, you are thinking, how could anyone suggest a 50-percent decline in the market is NOT a bear market. Logically you are correct. However, technically, we need an essential distinction between a “correction” and a “bear market.”
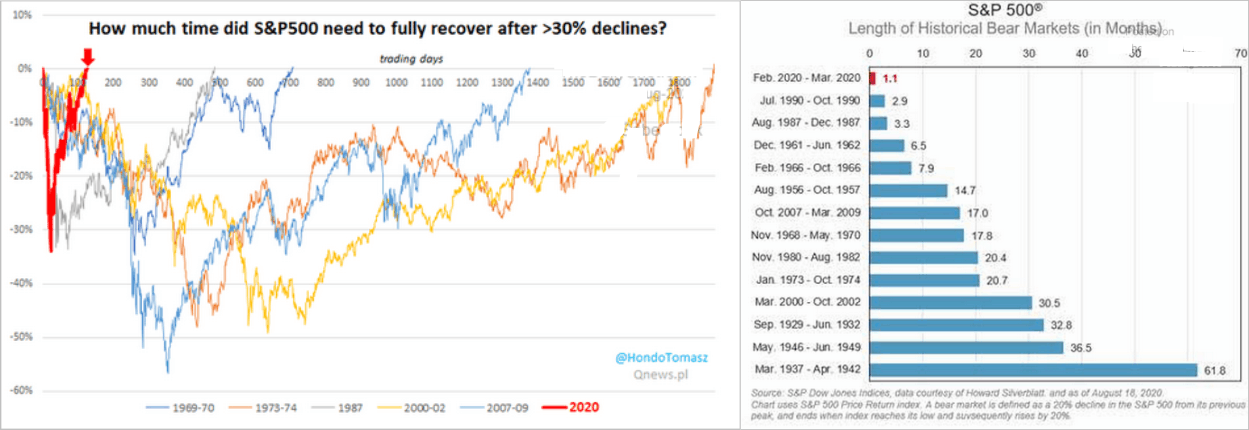
In March 2020, the stock market declined a whopping 35% in a single month. It was a rapid and swift decline and, by all media accounts, was an “official” bear market. But, of course, with the massive interventions of the Federal Reserve, the reversal of that decline was equally swift. As YahooFinance pointed out at the time.
“The S&P 500 set a new record high this week for the first time since Feb. 19, surging an eye-popping 51% from its March 23 closing low of 2,237 to a closing high of 3,389 on Tuesday. This represents the shortest bear market and third fastest bear-market recovery ever.”Sam Ro
However, as I discussed at the time, March 2020, much like the “1987 crash,” was in actuality only a correction. To understand why March was not a “bear market,” we must define the difference between an actual “bear market” and a “correction.”
Defining A Correction & A Bear Market
Start with Sentiment Trader’s insightful note following the 2020 recovery to new highs.
“This ended its shortest bear market in history. Using the completely arbitrary definition of a 20% decline from a multi-year high, it has taken the index only 110 days to cycle to a fresh high. That’s several months faster than the other fastest recoveries in 1967 and 1982.”
Note their statement that the media’s definition of a “bear market” consisting of a 20% decline is “completely arbitrary.” Given that price is nothing more than a reflection of the psychology of market participants, using the 20% definition may not be accurate any longer.
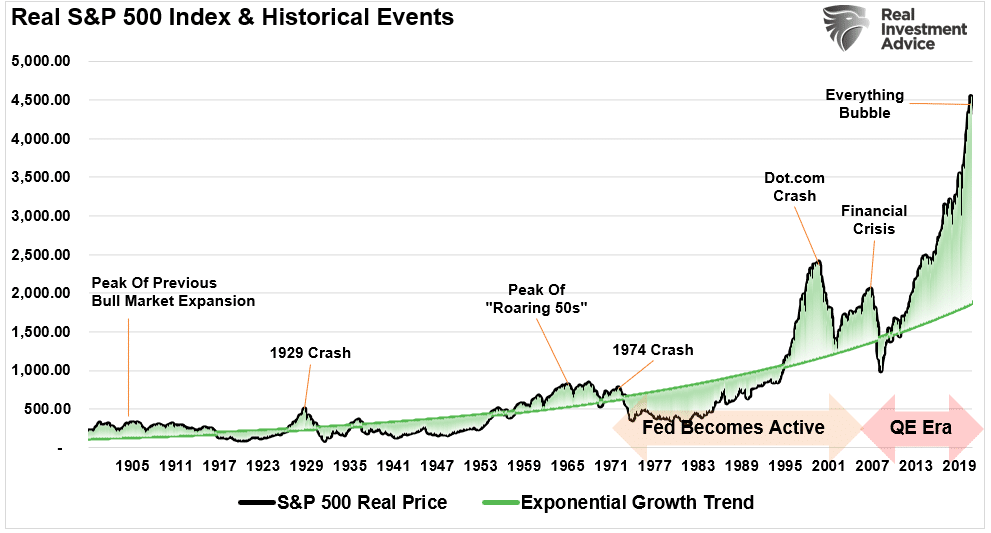
Over the last 12-years, the pace of price increases accelerated due to massive fiscal and monetary interventions, extremely low borrowing costs, and unrelenting “corporate buybacks.” As shown, the deviation from the exponential growth trend is so extreme it dwarfs the “dot.com” era bubble.
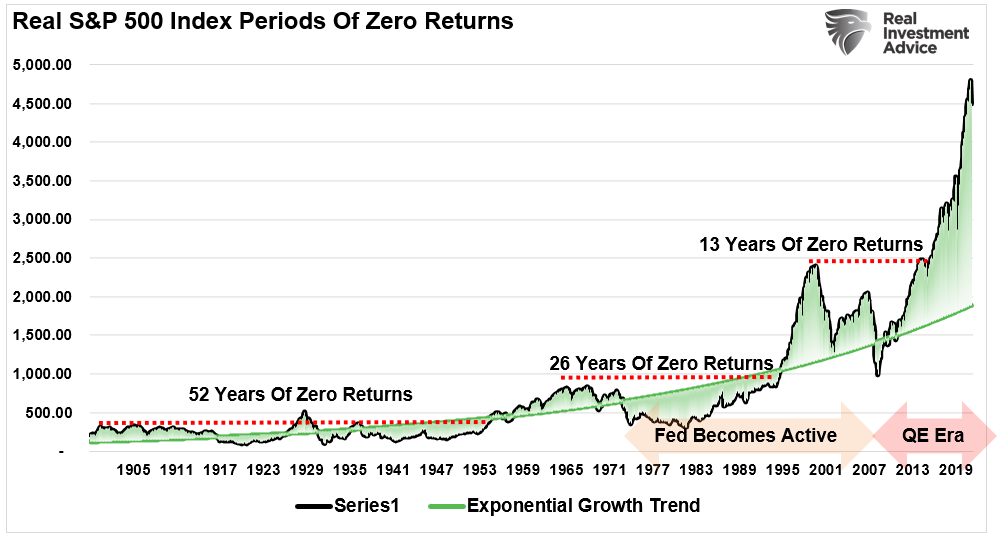
One crucial point is that large deviations above the exponential growth trend historically “mean revert.” Such reversions previously led to very long periods of no returns.
So, what should the definition of a “bear market” actually be?
What Defines A Bear Market
To answer that question, let’s agree on a basic definition.
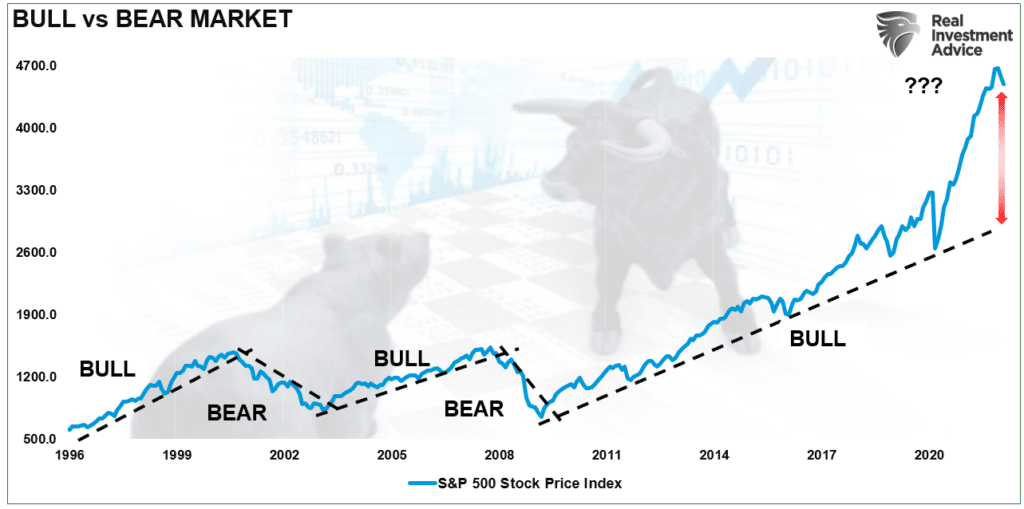
  • A bull market is when the price of the market is trending higher over a long-term period.
  • A bear market is when the previous postive-trend breaks, and prices trend lower.
The chart below provides a visual of the distinction. When looking at price “trends,” the difference becomes apparent and valuable.
The distinction is also essential to understanding the difference between “corrections” and “bear markets.”
  • “Corrections”generally occur over short time frames, do not break the prevailing trend in prices, and are quickly resolved by markets reversing to new highs.
  • “Bear Markets” tend to be long-term affairs where prices grind sideways or lower over several months as valuations are reverted.
The price decline in March 2020 was unusually swift using monthly closing data. However, that decline did not break the long-term bullish trend and quickly reversed to new highs, suggesting it was a “correction.”
Given the already large deviations from the trend in 2020, it required more than a 20% decline to retest the trend. If you review the chart above, the subsequent retest of the bullish trend will require something substantially larger in magnitude.
Just A 50-Percent Decline
Lately, there has been much discussion that a major “bear market” is looming. But given the massive deviation from historical norms, would such a reversion fit the actual definition of a bear market, or will it remain a correction in an ongoing bull trend?
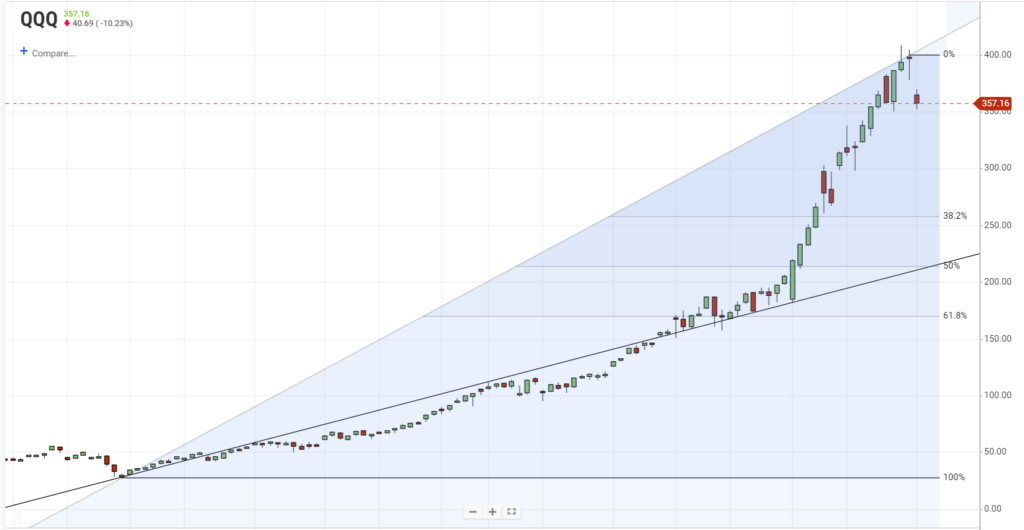
Let’s look at the Nasdaq Index (QQQ), for example. For the first time since March 2020, the index is trading below the 50, 100, and 200-day moving averages. With those previous support levels broken, there could be a “trend change” in the markets.
As noted, the “price trend” is what denotes a “bull” or “bear” market. Since March 2020, the markets traded primarily above their moving averages, suggesting a bull market was intact. However, with markets now trading below those averages, the market’s tone is changing.
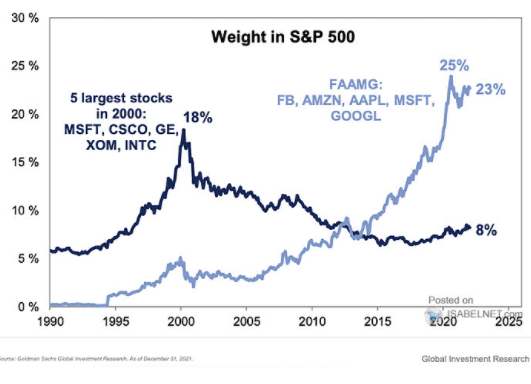
Focusing on the Nasdaq is helpful given the extreme weighting of just five companies. The same applies to the S&P 500. The recent cracking of Facebook and Netflix following earnings reports is just a taste of what happens if the support of those “Generals” gets lost.
If the “growth” period of the market is over, then the Nasdaq has a substantial way to fall to complete a 50-percent decline from the 2009 lows. However, that correction would only return the Nasdaq to its previous bullish trend line. Such would imply the bullish trend of prices, or bull market, remain intact.
A 61.8% retracement would make it a “bear market” by breaking the bullish trend.
When you realize that a 50-percent decline in prices would still maintain the “bullish trend” of the market, it just shows how exacerbated markets are due to a decade of monetary interventions.
Fed Driven Excesses Broke The Rules
The over-reaction by the Federal Reserve in 2020 to “bailout” the financial markets due to the pandemic led to market excesses historically unprecedented.
As such, the inevitable “mean reversion” will likewise be just as unprecedented.
A look at the long-term monthly price chart and MACD signal of the S&P 500 index tells the same story.
The current deviation above the running bullish trend lines dwarfs anything seen previously. Notably, that deviation is solely due to the massive injections of liquidity into the financial markets over the last 2-years.
Such is why it is hard to comprehend that a 50% decline in the market wouldn’t technically qualify as a “bear market” as the bullish trend would remain intact.
However, please don’t misconstrue what I am saying. A “mean reversion” will be devastating to the financial wealth of invested households.
Is the decline in January the beginning of something larger? It could be.
Every bear market in history has an initial decline, a reflexive rally, then a protracted decline which reverts market excesses. Investors never know where they are in the process until the rally’s completion from the initial fall.
The deviation of the market due to Fed stimulus was so extended above long-term trends in March 2020, the depth of that “correction” was not surprising.
Given the current deviation dwarfs all others, suggesting that the subsequent decline’s depth is equally as great.
Of course, the question is whether the next round of Federal Reserve interventions will be enough to restore “financial stability.”
“Don’t stress, none of this will happen,” you say?
Maybe? I certainly hope not.
But are you willing to bet your retirement on it?