Closing Stock Market SummaryThe S&P 500 fell 1.2% on Wednesday after being up 1.9% intraday, as momentum faded and news of the first reported case of the Omicron variant in the U.S. weighed on sentiment. Stocks closed at session lows amid a wave of selling interest in the final minutes of the session.
The Dow Jones Industrial Average fell 1.3%, the Nasdaq Composite fell 1.8%, and Russell 2000 lost 2.3%.
The major indices were up as much as 1.5-2.5% intraday, purportedly as concerns about the Omicron variant and the Fed's policy course were set aside and investors put new money to work on the first day of the month. There were suspicions, though, if the market's rally had a firm foundation for sustained gains given the recent volatility.
All 11 S&P 500 sectors were trading higher, but only one escaped with a gain. The consumer discretionary (-1.9%) and communication services (-2.0%) sectors led the retreat 2% declines, while the utilities sector (+0.2%) managed to close higher.
High-beta growth stocks were among the weakest performers, receiving little support from a decline in long-term interest rates. The 10-yr yield declined one basis point to 1.43% after hitting 1.50% overnight.
The ARK Innovation ETF (ARKK 98.60, -7.09, -6.7%), which contains many high-growth story stocks, fell 6.7% as investors shied away from riskier equities. Dow component Salesforce.com (CRM 251.50, -33.46, -11.7%) struggled all session and closed lower by 11.7% after providing disappointing guidance.
Value stocks outperformed on a relative basis, but it probably wasn't because of the better-than-expected November ADP Employment Change report and ISM Manufacturing Index since cyclical stocks struggled. Instead, many of the defensive value stocks in the health care and consumer staples industries did okay today.
The 2-yr yield rose four basis points to 0.56% as the market continued to signal expectations for the Fed to tighten policy more quickly. The U.S. Dollar Index increased 0.1% to 96.08. WTI crude futures fell 0.8%, or $0.53, to $65.61/bbl after being up more than 4.0% early in the session.
Reviewing Wednesday's economic data:
- The November ISM Manufacturing Index checked in at 61.1% (consensus 61.0%), up slightly from 60.8% in October. A number above 50.0% is indicative of expansion. November marked the 18th straight month of expansion for the manufacturing sector.
- The key takeaway from the report is that manufacturing activity is still running at a good clip despite supply chain, transportation, and labor constraints; meanwhile, it was noted that manufacturers' sentiment remains strongly optimistic.
- Total construction spending increased 0.2% month-over-month in October ( consensus +0.4%) following a downwardly revised 0.1% decline (from 0.0%) in September. Total private construction declined 0.2% month-over-month while total public construction spending increased 1.8%.
- The key takeaway from the report is the decline seen in new single family and multifamily construction. That is most likely the consequence of ongoing supply chain pressures, labor constraints, and higher costs for builders that are standing in the way of building more affordable homes.
- The ADP Employment Change report estimated 534,000 jobs were added to private-sector payrolls in November (consensus 515,000). The increase in October was downwardly revised to 570,000 from 571,000.
- The final IHS Market Manufacturing PMI for November checked in at 58.3, down from 59.1 in the preliminary reading.
- The weekly MBA Mortgage Applications Index fell 7.2% following a 1.8% increase in the prior week.
Looking ahead, investors will receive the weekly Initial and Continuing Claims report on Thursday.
- S&P 500 +20.2% YTD
- Nasdaq Composite +18.4% YTD
- Dow Jones Industrial Average +11.2% YTD
- Russell 2000 +8.7% YTD
After Hours Summary: SNOW +13.1%, FIVE +8.4%, ZUO +7.5% higher on earnings; ESTC -7.1%, VEEV -5.4% lower on earnings; SQ +1.2% to change its name to BlockAfter Hours Gainers:
Companies trading higher in after hours in reaction to earnings/guidance: SNOW +13.1%, FIVE +8.4%, ZUO +7.5%, NCNO +3.2%, CRWD +2.8% (also selected by CISA to support protection of critical endpoints and workloads), AI +2.6%, OKTA +2%, SPLK +1.6%, DSGX +0.8%
Companies trading higher in after hours in reaction to news: CLVT +2.8% (completes acquisition of ProQuest; also reaffirms FY21 guidance and provides combined outlook for FY22; also names new CFO), TRIT +1.6% (provides update on independent audit), FLGT +1.3% (confirms its RT-PCR tests detect Omicron variant), SQ +1.2% (to change its name to Block), CVX +0.4% (announces $15 bln capital and exploratory budget for 2022; also raises its share buyback guidance range to $3-5 bln/yr), NR +0.4% (acquires Lentzcaping for $14 mln in cash), SWIR +0.3% (names new chair of board), AAPL +0.3% (autos engineer Michael Schwekutsch leaving AAPL to join electric aviation startup Archer, according to CNBC), AMGN +0.2% (announces top-line results from Phase 3 DISCREET trial), PSB +0.1% (declares one-time special dividend of $4.60/sh), DIS +0.1% (names Susan Arnold as new board chair; replace Bob Iger when he departs at year-end), SJM +0.1% (sells its private label dry pet food business for $33 mln in cash; updates guidance)
After Hours Losers:
Companies trading lower in after hours in reaction to earnings/guidance: ESTC -7.1%, VEEV -5.4%
Companies trading lower in after hours in reaction to news: KPLT -13.9% (provides inter update on quarter-to-date gross orginiations), WE -5.3% (discloses material weakness in internal control over financial reporting, to amend financial statements), VBIV -3.2% (to present new survival data from Phase 2a Study), AIRC -3.2% (files mixed securities shelf offering), DAN -0.9% (names new CFO), COST -0.9% (reports Nov adjusted comps of +9.2%), TARO -0.8% (names new CFO), RRD -0.2% (board decides that Chatham acqusition propsal is superior to Atlas deal), FIX -0.1% (to acquire Ivey Mechanical), WOR -0.1% (acquires Tempel Steel for $255 mln), UNVR -0.1% (acquries Sweetmix), WNC -0.1% (backlog grows to a record $2.3 bln during NovQ), WBX -0.1% (launches app for electric vehicle charger installers in seven countries)
Dan Loeb fends off rival activists at London-listed Third Point fund
Insurgents led by AVI complained about valuation gap between main and feeder funds
Dan Loeb has scored a victory in his battle with insurgent investors at his London-listed investment company, winning a crucial shareholder vote.
The New York-based activist has himself been under attack from activists, who have complained about a valuation discount between the main fund at Loeb’s Third Point and a London-listed feeder fund Third Point Investors Ltd.
Asset Value Investors, the largest insurgent, had urged TPIL shareholders to remove Josh Targoff, Third Point general counsel, from the London fund’s board as a signal of their support for the activists’ position. But that motion was defeated in a three-to-one vote at a meeting on Wednesday.
“Given the result of the vote announced at the extraordinary general meeting held today, the board expects that AVI will now cease in its attempts to impose its self-serving agenda,” TPIL said.
AVI said the results showed it had “emphatic backing” from independent shareholders, but that the balance was tipped in part by votes from Loeb, who is TPIL’s largest shareholder.
“It is in no one’s interest that this dispute plays out any longer in public, and we very much hope that the board will now be willing to enter into discussions with us privately”, AVI said.
The fight between Loeb and AVI, a £1.2bn London fund manager, centres on measures to narrow the gap between TPIL’s share price and its net asset value, which consists of exposure to Third Point’s main Cayman Islands-based fund.
Shareholders voted to back the board’s plan, which will try to shrink the discount through a share exchange facility with the main Third Point fund.
TPIL serves as a “feeder fund” passing investors’ money through to Third Point, which manages about $20bn of assets and is known for tough activist fights with big public companies, including a recent campaign to break-up Shell.
The discontented shareholders have accused Loeb of hypocrisy over his response to their campaign. Richard Webb, CEO of Metage Capital, one of the activists, said in October that the manager’s actions were “in stark contrast to the views frequently expressed by Dan Loeb when an investor himself”.
Loeb meanwhile has voiced his frustration at the challenge from UK shareholders on Twitter. “I hear the buzzing of a harmless insect. I believe it is a gad fly. Someone hand me a swatter,” Loeb tweeted about AVI last month. “Describing [AVI’s] antics as infantile is an insult to crying babies”, he said.
Fellow billionaire hedge fund manager John Armitage, who is TPIL’s third-largest shareholder, came to Loeb’s defence on Wednesday. He praised the company’s management and said “shareholders who are unsatisfied should sell their positions rather than distract the company by their futile stunts”.
The discount between TPIL to Third Point has recently narrowed to 13 per cent. The board hopes to close the gap further by encouraging new buyers, but on Wednesday said that “potential new shareholders . . . have expressed hesitance in purchasing shares whilst this distracting drama continues”.
Yellen Defends Spending Plans Amid Growing Angst Over Higher Inflation
Treasury secretary and Fed Chairman Powell address lawmakers’ concerns in second day of testimony
Treasury Secretary Janet Yellen on Wednesday defended the Biden administration’s spending plans this year from Republicans’ criticism that fiscal policy had overstimulated the economy and fueled higher inflation.
“We had a very sizable fiscal stimulus,” Ms. Yellen told the House Financial Services Committee. “We addressed what was a very substantial risk” of a prolonged economic downturn, she said.
Ms. Yellen disputed concerns raised by Rep. Patrick McHenry (R., N.C.), the committee’s top Republican, that the Biden administration had spent too much money when Congress and the White House approved a $1.9 trillion relief spending measure in March.
“Inflation is a matter of demand and supply, and it’s certainly true that the American Rescue Plan put money into people’s pockets,” Ms. Yellen said. “But if you look at the amount of inflation that we have and its causes, that is at most a small contributor.”
Inflation has surged this year—to 5% in October from a year earlier, according to the Federal Reserve’s preferred gauge—amid strong demand for goods and services that have faced supply-chain bottlenecks associated with reopening the economy from the Covid-19 pandemic.
Ms. Yellen said inflation was being driven more heavily by a shift in the composition of spending to goods and away from services than it was by increased government outlays.
Her defense of the March aid package came as Democrats are aiming to give final congressional approval for President Biden’s roughly $2 trillion spending proposal for climate change, child care and other social programs. Republicans have been pointing to the March bill to argue that additional spending would worsen inflation.
Higher inflation has put pressure on the Fed to raise interest rates earlier next year than officials had anticipated just a few months ago. Ms. Yellen testified alongside Fed Chairman Jerome Powell, who said that inflation risks had grown recently.
“The risks of higher inflation have moved up,” he said on Wednesday. While many of the inflationary pressures this year are still tied to factors associated with reopening the economy from the pandemic, inflation “has spread more broadly in the economy,” Mr. Powell said.
Mr. Powell said in a Senate hearing on Tuesday that the Fed was preparing to wind down its easy-money policies more quickly, opening the door to raising interest rates in the first half of next year. The comments sent stock markets tumbling and government bond yields up.
“We will use our tools to make sure that this high inflation we’re experiencing is not entrenched,” Mr. Powell said on Wednesday.
The Fed is grappling with how to chart policy amid an inflationary surge that has been larger and is proving to last longer than most private-sector economists expected. The emergence of the Omicron coronavirus variant adds a new degree of unpredictability by threatening to exacerbate supply-chain bottlenecks.
The Biden administration has been working to show that its policies will help address supply chain issues and elevated inflation, amid criticisms from Republicans that Democrats’ roughly $2 trillion social-spending proposal would add to inflationary pressures and the U.S. deficit.
Ms. Yellen during Wednesday’s testimony said the package wouldn’t add to the national deficit or debt and would help to promote labor-force participation and ease financial constraints for American families.
The nonpartisan Congressional Budget Office found that the package would add $367 billion to the deficit over 10 years, but Ms. Yellen and other Democrats have noted that estimate doesn’t include expected revenue from measures in the bill providing for stricter tax enforcement at the Internal Revenue Service. The White House and Treasury Department have estimated those enforcement activities would generate roughly $480 billion in revenue over 10 years, while the CBO estimates that figure would be $207 billion.
Is A Stock Market Crash Like 2000 Possible?
“Say say two thousand zero zero party over, oops, out of timeSo tonight I’m gonna party like it’s nineteen ninety-nine” -Prince 1999
Prince wrote the song “1999” in 1982, 18 years before the clock ran out on the 20th century and possibly the greatest stock market run in American history.
In 1999, equity valuations stood at unprecedented peaks, even dwarfing those of 1929. At the time, investors were euphoric as if the rally were eternal. Newbies were killing it, and veterans were cleaning up like never before. Some stocks were rising 10, 20, and even 30% or more in a day. Companies adding dot com to their name or discussing new internet technology saw huge pops in their share prices. Investors bought the narrative with little to no due diligence.
Sound familiar? Not only is today’s speculative environment eerily similar to the late 90s, but valuations, in many cases, are frothier than that period.
Comparing valuations from separate periods is inaccurate as economic and earnings environments can be different. This article contrasts the valuations and environments to consider if it’s time to leave the party or stay and rock on. To help you decide we provide a statistical analysis showing the potential downside risk facing the S&P 500.
First, however, let’s look at a few valuation measures to provide context between today and 1999.
S&P 500 Price to Earnings
Price to earnings (P/E) is the most often used method to value stocks. It’s common for investors to use the trailing 12 months (ttm) of earnings in the P/E denominator, as shown in the first graph.
Some investors, including ourselves, prefer using the CAPE P/E. Robert Shiller’s CAPE method uses the last ten years of earnings to better factor in secular earnings trends and avoids one-off events that distort valuations.
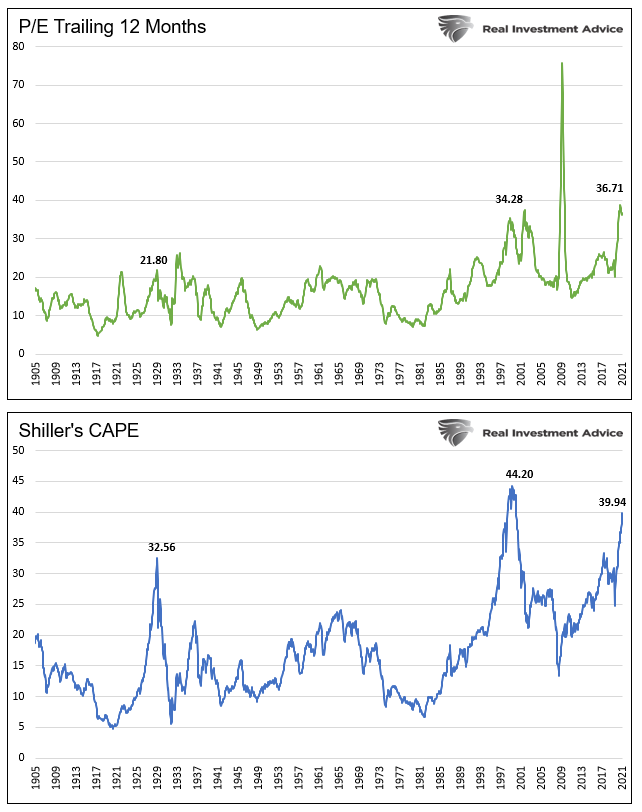
P/E valuations are grossly extended, and in both calculations nearing or surpassing levels in 1999. The graphs also show valuations are well above those of 1929.
Price To Sales
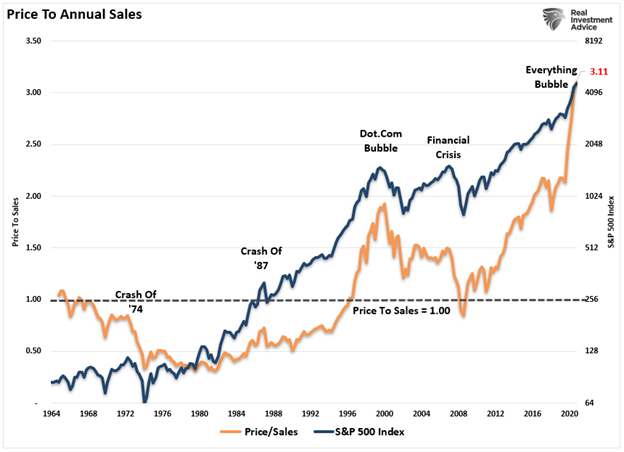
The benefit of using the ratio price to sales (P/S) versus P/E is that sales, or revenue, are not easy to manipulate by executives.
The graph below shows the price to sales ratio (P/S) is now 50% above where it was in 1999.
The charts below, courtesy of the Leuthold Group, provide further context. The top chart shows 15% of the S&P 500 stocks have a P/S ratio greater than ten. That compares to 8% in 1999. The bottom graph shows the median P/S ratio is nearly double the 1999 level.
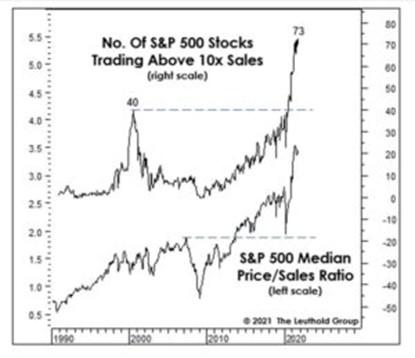
To highlight what a P/S ratio of ten entails, we quote Scott McNeely, the CEO of Sun Microsystems, from 1999.
“At 10 times revenues, to give you a 10-year payback, I have to pay you 100% of revenues for 10 straight years in dividends. That assumes I can get that by my shareholders. It assumes I have zero cost of goods sold, which is very hard for a computer company. That assumes zero expenses, which is really hard with 39,000 employees. That assumes I pay no taxes, which is very hard. And that assumes you pay no taxes on your dividends, which is kind of illegal. And that assumes with zero R&D for the next 10 years, I can maintain the current revenue run rate. Now, having done that, would any of you like to buy my stock at $64? Do you realize how ridiculous those basic assumptions are?”
More Valuation Metrics
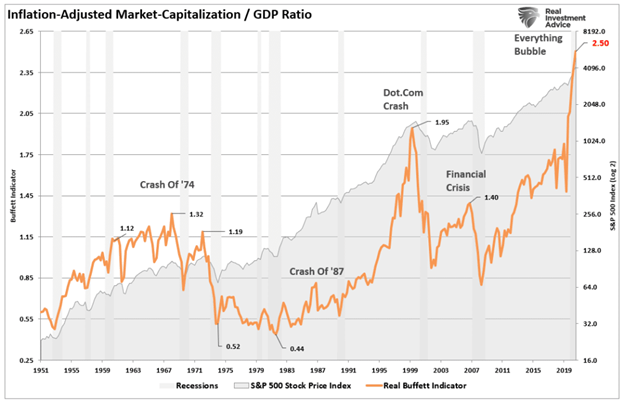
The following graph is purportedly Warren Buffet’s favorite valuation technique. The measure compares the inflation-adjusted market cap of the S&P 500 as a ratio to the economy. Given that earnings and economic growth correlate well over time, the ratio effectively points out valuation extremes. Currently, the ratio is at 2.50, well above the 1.95 from 1999 and 1.40 leading into the Financial Crisis.
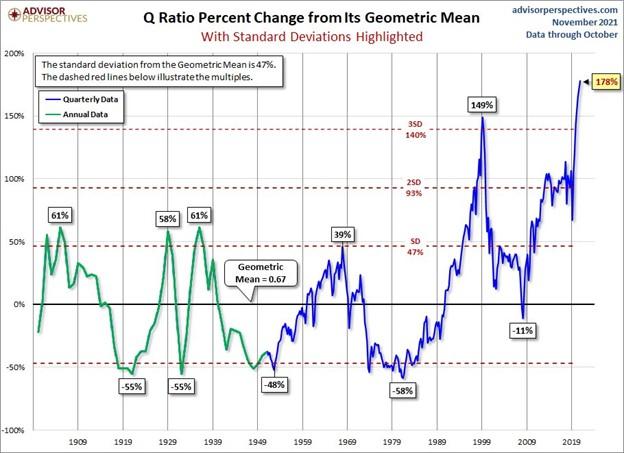
The Q-ratio takes the S&P 500 market cap and divides it by the aggregate replacement costs of the assets held by the companies in the index. It effectively quantifies how much an investor is paying for the underlying corporate assets. As shown below, courtesy of Advisor Perspectives, the ratio is now over 3.5 standard deviations above its norm. It is also higher than it was in 1999 and multiples of any other prior peak.
Compared to What?
Conservatively speaking, current valuations are on par or greater than those in 1999 and any other period. Such a statement is statistically factual, but it ignores the economic environments of both periods. For instance, if you think the economy and corporate earnings will grow at double-digit rates for years, we can make the case valuations are fair today.
The table below compares economic environments from both periods.
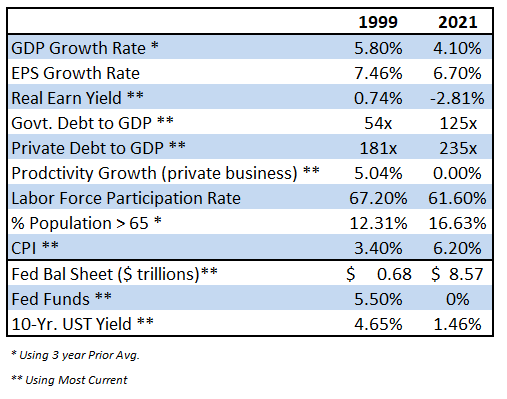
Economic and earnings growth rates today are weaker than 20 years ago. Further, debt levels, measured as a ratio to GDP, are much higher today. Productivity growth and demographics, two significant factors determining economic growth, are weighing on economic growth today. In the 90s, they were strong economic tailwinds.
The last three indicators show the amount of monetary stimulus via low-interest rates, and the Fed’s enlarged balance sheet is much more accommodative than in 1999.
Fundamentals and the economic/earnings outlook are weaker today than in 1999. As a result, investors were better off paying higher valuations in 1999 than today.
However, the Fed is, directly and indirectly, bolstering asset prices and, therefore, valuations via their excessive actions. Low-interest rates promote the use of leverage and encourage buybacks which fuel stock prices. Additionally, investors shun low-yielding bonds to chase stocks to pick up needed returns. For more, please read The Fed is Juicing Stocks.
The Fed is the Fundamentals
The bottom line is investors are paying more and getting less compared to 1999. The graph below shows numerous measures of valuations are at extremes except three. Those three in green shading use comparisons of stock prices to interest rates. They are “fairly valued.”
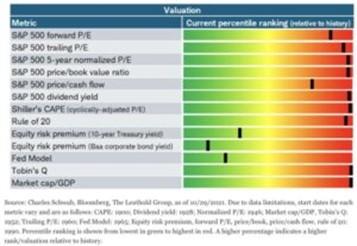
Whether they know it or not, investors are betting the Fed continues to levitate the market. Can stocks remain at extremely lofty valuations while lacking fundamental backing if the Fed continues to reduce QE purchases and ultimately raises interest rates?
Essentially the real gamble investors are taking is that inflation will be transitory. If high inflation is persistent and not transitory, the Fed will find it increasingly challenging to continue current policy.
Without the Fed’s enormous liquidity, valuation gravity will reassert itself.
Statistics Warn of 2650
The graph below shows the strong correlation between CAPE valuations and future 20-year returns. At current levels, highlighted in yellow, we should expect annualized returns ranging from 2-4% for the next 20 years.
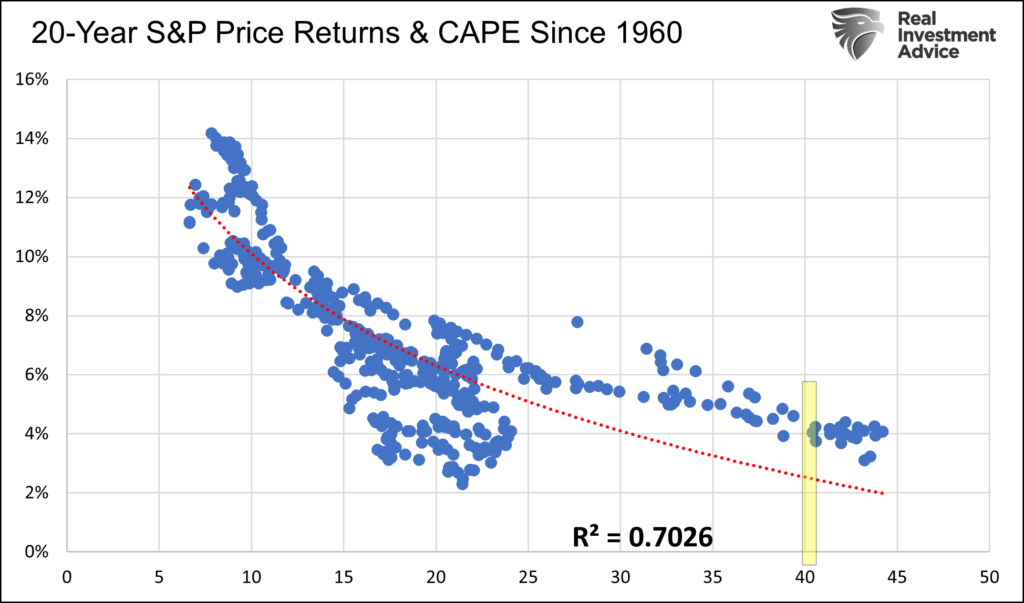
You may be thinking 2-4% doesn’t sound too bad considering how high valuations are. The problem, however, with such a long-range forecast is there may be periods with negative growth and others with double-digit growth within the twenty years.
While the regression allows us to form 20-year expectations, it also gives us the ability to forecast shorter periods.
Eighteen years ago, in October 2003, the S&P stood at 1019.50. Based on the regression above, investors could expect 4.90% annualized returns at that time. At such a growth rate, the S&P would rise to 2655 in October 2023. Currently, the S&P 500 is around 4700. Assuming the regression holds and history has favorable odds of that occurring, we should expect the S&P 500 to fall to 2650 in the next two years. A 43% decline is harsh, but it will only leave the index at fair value based on the last 40 years of CAPE levels. Quite often, markets revert below their means.
Before you dismiss our statistical analysis, let’s look back to 1999.
Prince wrote “1999” in 1982. When he wrote it, the S&P was at 111. Using the same math, investors could have expected 12% annualized returns, putting the S&P 500 at 1068 on New Year’s Eve 1999. The S&P, at the end of 1999, was 1450, offering investors a two-year expected return of -26%. Statistics delivered right on cue, and just two years later, the S&P hit 1068. The index ultimately fell to the low 800s before the stock market crash ended.
Summary
Every era of speculation brings forth a crop of theories designed to justify the speculation, and the speculative slogans are easily seized upon. The term “new era” was the slogan for the 1927-1929 period. We were in a new era in which old economic laws were suspended.” -Dr. Benjamin Anderson – Economics and the Public Welfare
Investors are making a big bet on the Fed and a “new era.”
On the eve of the stock market crash in 1929, Irving Fisher erroneously declared that stocks hit “what looks like a permanently high plateau.” Fisher could not have been more wrong. Same with investors in the “new era” of the internet of the late 90s.
Do you have faith the “new era” of Fed-managed markets can levitate stocks well above historical norms and prevent a stock market crash? Or will this “new era” resolve itself like prior “new eras” with a stock market crash?
Barry Diller’s media empire settles legal fight with Tinder founders
Match Group agrees $441m payment to resolve lawsuit over dating app’s valuation
Match Group has agreed to pay the founders of Tinder $441m to settle a lawsuit in which the dating app’s founders claimed the media empire run by Barry Diller had cheated them out of the fortune created from one of the hottest digital media properties in recent years.
The settlement comes in the middle of a trial in New York state court, where Sean Rad and several others who had built Tinder in Los Angeles a decade ago had asked a jury to award them more than $2bn from Match and its former corporate parent, IAC.
The court proceedings over the past three weeks had featured testimony from Rad, Diller and others involved in a 2017 transaction that bought out the founders, who collectively held a stake equal to a fifth of Tinder, for roughly $600m, implying an aggregate valuation of Tinder at $3bn.
Rad and the founders later sued, arguing that the app was really worth $13bn at the time. The founders claimed Match and IAC executives had privately acknowledged Tinder was worth far more than the buyout valuation of $3bn and had even compared its trajectory with the likes of Uber and Twitter.
Rad and his team had initially developed Tinder at Hatch Labs, a technology incubator that IAC had sponsored to build internet start-ups. In 2014, Rad negotiated a deal in which Tinder was granted “put” options where they could sell back their interest in the company to IAC at four specified intervals starting in 2017 and ending in 2021.
After the first put process in 2017, where independent investment bankers valued Tinder at $3bn, IAC immediately merged Tinder into the broader Match company, cancelling the future put events and forcing Rad and the founders to accept the $3bn valuation.
Match Group, which now includes Tinder and several other dating sites, has since seen its enterprise value soar to as much as $50bn. Wall Street analysts ascribe the majority of that figure to Tinder.
Match and IAC had argued that Rad — who immediately sold the IAC shares his Tinder equity had converted to in 2017 — suffered from “seller’s remorse”, and that he had been given the chance during the valuation process to argue Tinder was worth more.
While the trial was nominally about corporate valuation, the internal drama at IAC, which over the years had fostered such digital stars as Expedia and Vimeo, spilled out in public.
Emails shown during the trial revealed that Diller shared his excitement about Tinder with Rad, telling him in a 2014 email that his personal yacht crew was using the app. Rad had been later sacked as Tinder’s chief executive on two different occasions, as IAC’s management team questioned his maturity.
Match, whose shares have fallen 14 per cent in the past month, said it would pay the settlement from its cash on hand. Analysts at Susquehanna Financial Group had previously pegged a possible compromise at between $300m and $700m.
Representatives for Sean Rad declined to comment. Match Group declined to comment.