Who really thought Apple will Go for Gopro ???
1
Fed's Bullard (hawk; FOMC voter in 2016): does not see much more appreciation in dollar going forward - Q&A
- expects divergence in monetary policy between US and Europe has been priced in
- should help curb futher increases in value of the dollar
- does expect some problems in parts of oil market related to decline in oil prices
Glencore launches refinancing of credit line
Glencore has launched an early refinancing of one of its main credit facilities, bankers familiar with the process said, as the mining and trading house tries to shore up investor confidence amid the biggest commodity rout in two decades.
The terms for the $8.45bn, one-year revolving credit facility — used to fund Glencore’s business of transporting and storing commodities including coal, oil and copper — are expected to be on similar terms to last year, banking sources said. A Glencore spokesman confirmed the process had started.
The early launch — last year Glencore approached its top lenders in late February — comes as the world’s biggest commodity traders try to show they still enjoy access to cheap financing even as oil and metal prices have continued sliding in 2016.
Bookrunners on the deal are ABN Amro, HSBC, ING, Bank of Tokyo-Mitsubishi UFJ and Santander, which have already received approval from their credit committees to back the deal.
They are looking to complete the refinancing before the company announces annual results on March 1, and will then launch a wider syndication.
Glencore’s share price has fallen by more than 20 per cent in the first two weeks of this year and is within just a few cents of its all-time low of 67p. That level was hit in September, shortly before chief executive Ivan Glasenberg launched a sweeping debt reduction plan.
“We have a spent a lot of time from a credit perspective making sure everything is fine,” said one banker involved in the deal. “I think these guys have made the right noises; they are taking action and they have the bullets at their disposal to get it done.”
Several other commodity traders are also looking to refinance credit lines with their banks. Privately held Trafigura, one of Glencore’s biggest trading rivals, has said it expects to refinance around $4.3bn at slightly lower rates by the end of the first quarter, after a strong oil trading performance last year. Glencore has also hinted at a bumper year for its oil business.
Singapore-listed Noble Group, the largest commodity trader in Asia, is also looking to refinance its short-term credit facilities, though faces the additional hurdle of having had its debt downgraded to “junk” status by two of the three major rating agencies in recent weeks.
The collapse in commodity prices over the past 18 months has, at times, been beneficial for the biggest oil and metals dealers, with many reporting strong results from their trading divisions. Financing deals become cheaper when prices fall, while profitable storage and arbitrage opportunities tend to proliferate.
But Glencore transformed itself from a pure-play trader in 2013 with its takeover of mining company Xstrata, and is now juggling a higher debt load and greater exposure to the underlying price of metals, coal and iron ore.
--> GPRO -18%
GoPro falls to all time lows after cutting Q4 guidance: Analyst color on warning
- Wedbush cuts target to $18 from $33. They note the HERO4 Session has been a problem since its launch in early July. In early Dec, the price was cut for a second time to $199, but the second price cut apparently didn't stimulate sufficient to allow GoPro to approach Q4 top-line guidance. It also appears to have hurt gross margins, although they did note some discounting of other HERO4 capture devices in Q4 as retailers tried to improve sell-through. Current Q4 guidance implies roughly break-even EPS or a loss. They lower FY16 rev to $1.885 billion and EPS to $1.30 (consensus $1.88 bln and $1.16); Outperform.
- Barclays downgrades to Equal Weight from Overweight
- Northland Capital target lowered to $20 from $39
- Piper Jaffray cuts tgt to $9 from $15
- FBN downgrades to Sector Perform from Outperform; tgt lowered to $11 from $30
- JMP cuts tgt to $21 from $90
- GPRO down 20% at all-time lows; company now has $1.6 bln market cap, roughly equivalent to FY15 sales.
- The co's initial Q4 guidance was also below consensus.
- Supplier Ambarella (AMBA) is down 9%
PEUGEOT -Full statement from Peugeot - {http://www.psa-peugeot-citroen.com/en/media/press-releases/compliance-tested-vehicles-psa-peugeot-citroen }
The results of the tests conducted by the technical committee led by French environment minister Ségolène Royal have now been communicated to us. These results attest to the absence of anomalies on PSA Peugeot Citroën (Paris:UG) vehicles.
Despite last week's historic travails, there has been no rest for the weary - as equity markets remain volatile and under pressure through most of this weeks early sessions. Finding a late day bid deep around 1900 on the S&P 500 Monday, the index quickly recovered 20 points and closed just over flat. Working off Monday's pattern, the bulls quickly spilled early gains on Tuesday, before recovering sharply in a late day push. Wednesday, the S&P 500 followed this weeks intraday pattern and is revisited the lows from Monday.
Although traders may take some solace over the recent stick-save reversals, it pays to mention that the index is flirting with a major support zone just below, established in the fall of 2014 when the Fed terminated its active QE3 program at the end of October. Since then, the index has traded between modest gains and loses, with a cycle high put in last May.
Moreover, the index is now trading close to where major long-term support comes in around 1810 on the SPX. From our perspective, if the SPX breaks below its intermediate support zone around 1860, we suspect that longer-term support will be broken at the Meridian just a few percent away.
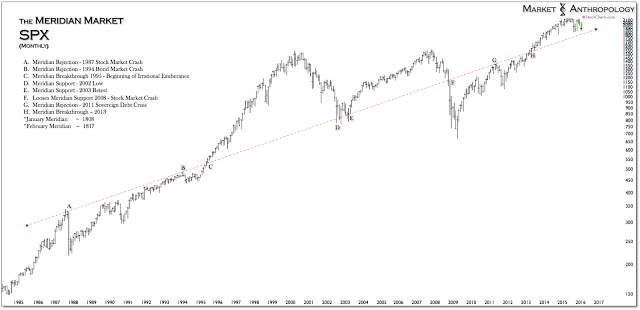
Fig. 1: Meridian Market: SPX Monthly 1985-2016
Our general outlook towards US equities has been that a cyclical top was in play and have viewed the 1946 cycle as the closest market parallel. This view was based primarily on our reads of:
- The long-term yield cycle and equity market valuations (i.e. CAPE ceiling from 07' cycle) that are greatly derivative from their bearing within the cycle; and
- The monetary policy backdrop that echoes the long normalization phase in the late 1940's from the extraordinary measures taken by the Fed and Treasury to support the markets after the Great Depression and through World War II.
For equity market investors today, the major takeaways from this period are two-fold:
- Equities that had been buttressed and supported by extraordinary measures had diverged from the underlying economy. The recession in 1945 was one of the only periods in history where the stock market overlooked economic conditions, gaining more than 20 percent even through the downturn. It was only after these measures ended in 1946 that valuations "normalized" with the economy and policy.
- Although the initial correction was swift and significant (~26 percent), the economy did not fall into participants greatest fear of another depression, but muddled through and was range-bound over the next three years (Figure 10) as the economy traversed the yield trough to its next major growth cycle.
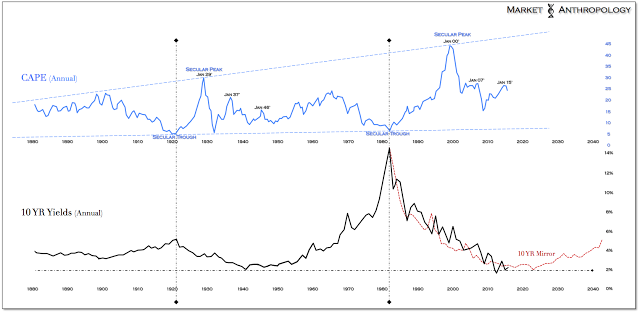
Fig. 2: Annual CAPE vs 20-Y Yields 1880-2016 (and beyond)
Overall, while the current cycle has its own inherent variables and unique catalysts, we continue to find merit with the big picture congruences with the 1940s. This implies that valuations in equities should modulate lower as policy further normalizes from the crisis stance it held over the past seven years and yields work their way across the shallow trough of the transitional divide.
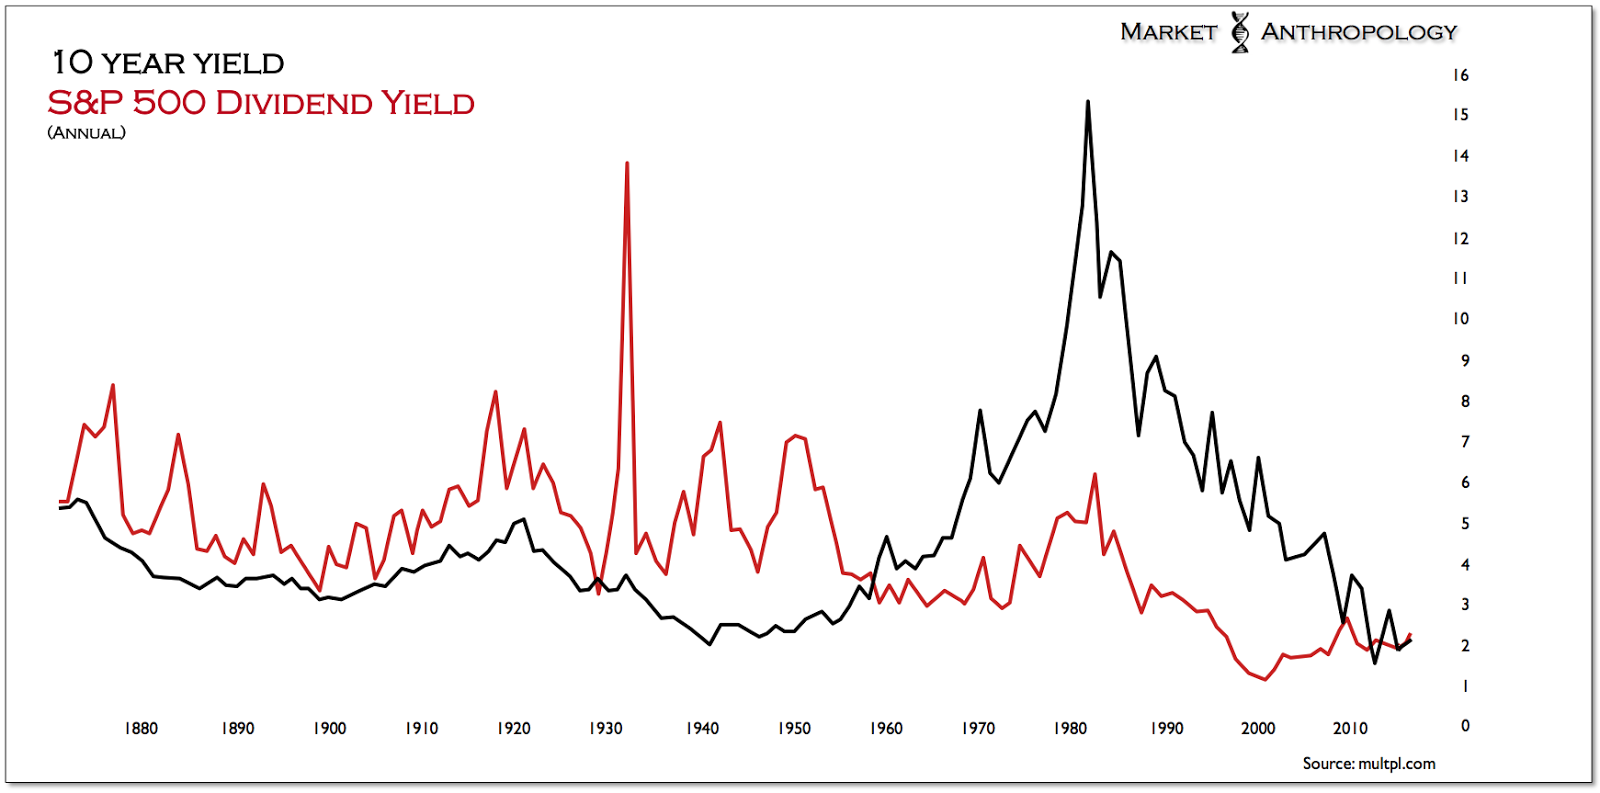
Annual 10-Y vs SPX Dividend Yield 1880-2015
Although we expect a modest rebound in long-term yields as the Fed moves further away from ZIRP, a secular move higher as last seen in 1950 is still likely years away. As such, we suspect that the sea change in yields we noted last year between theU.S. 10-Year and S&P 500 will continue to diverge as equities cyclically turn down and yields flag through the trough.
Technically, there are two broad-brush outcomes for US equities over the next year; We guesstimated subset probabilities for each.
- Bullish scenario A (30 percent probability) - The S&P 500 finds long term support at the Meridian and trades higher in a 20 percent range up to ~2200.
- Bullish scenario B, (10 percent probability) - The S&P 500 finds long term support at the Meridian and trades higher in a continuation of a secular bull market.
- Bearish scenario A, (55 percent probability) - Intermediate-term support fails for the SPX ~ 1860, causing equities to swiftly break through the Meridian and into the air pocket between the previous cycle high (10/07). A target of ~1576 would be a roughly 26 percent decline from the cycle high last May to the previous cycle high in October 2007. This is also within 1 percent of the 38.2% retracement level of the entire bull market rally that began in March 2009.
- Bearish scenario B, (5 percent probability) - Intermediate-term support fails for the SPX ~ 1860, causing equities to break through the Meridian and begin a third major bear market (~50% decline) since 2000.
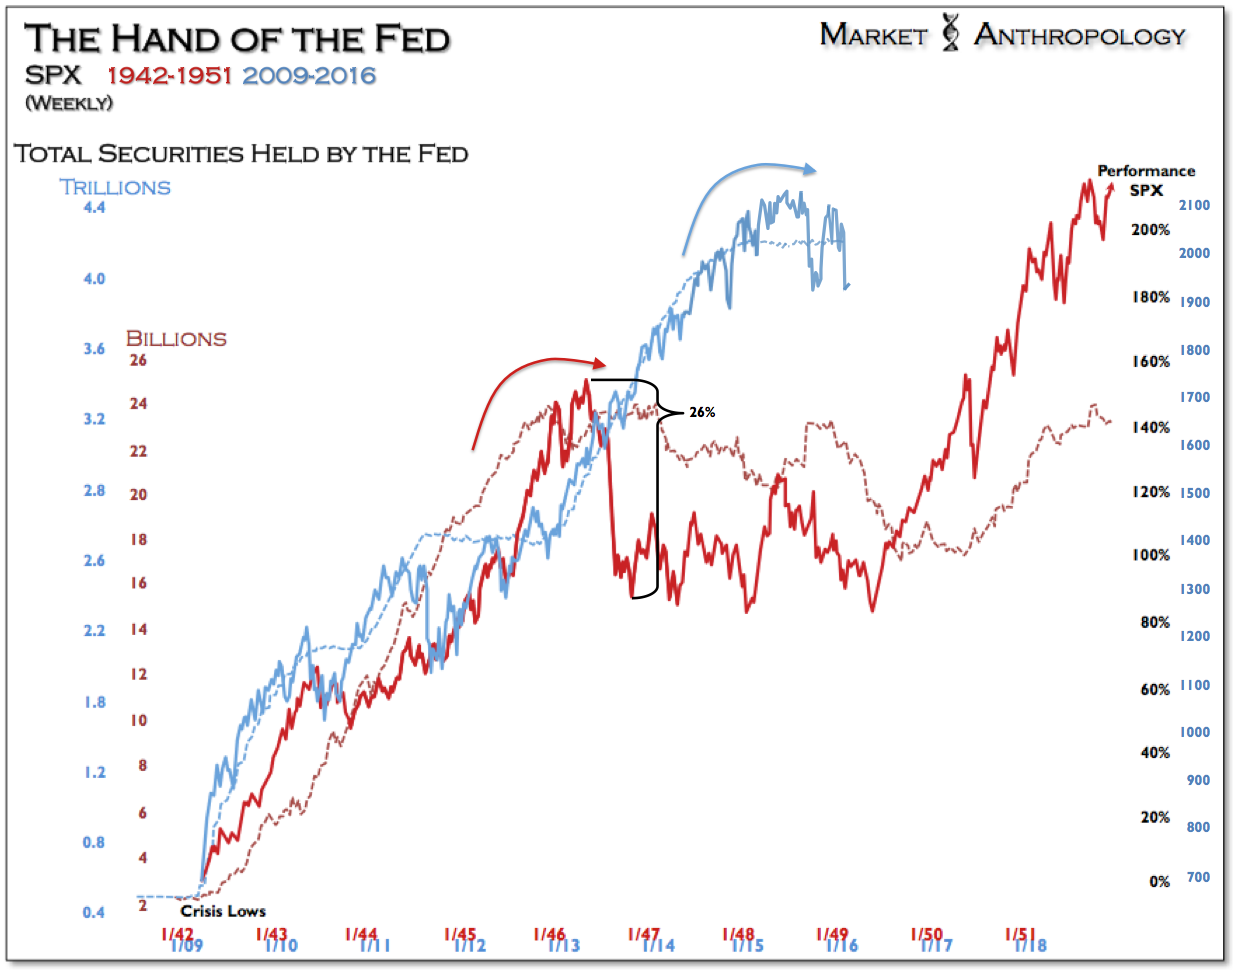
Fig. 3: SPX Weekly 1942-1951:2009-2016
As much as the 1929 and 1937 market declines scare up the most headlines, from a historical perspective, the less severe bearish scenario A would correspond with the cyclical downturn that began in 1946. And while the Fed's extended duration of QE this time around pushed valuations up to the ceiling of the previous cycle (07' CAPE - Figure 2), the three peaks of that period (1929, 1937 and 1946) have mimicked how the current pattern in CAPE has unfurled - and naturally the disposition of yields within the long-term cycle.
Getting back to current market conditions, the SPX is within a few percent of intermediate-term support, extended from the closing exhaustion low in October 2014. This level was also tested during the initial market decline last summer. Although we had used the 2011 low and retracement rally as a prospective guide in December, the recent leg down has broken that pattern (Figure 9). That said, when you view the broader structure over the past two years, it is also a fractal replication of the 2011 market top, which coincided with the end of QE2. The current market, which followed a much longer QE program and a much larger equity rally, has all of the same structural components of the 2011 top (Figure 5), just extended along a much longer timeframe.
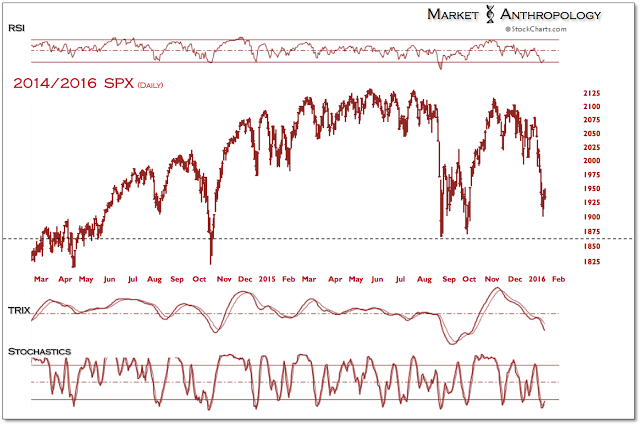
Fig. 4: SPX Daily 2014/2016
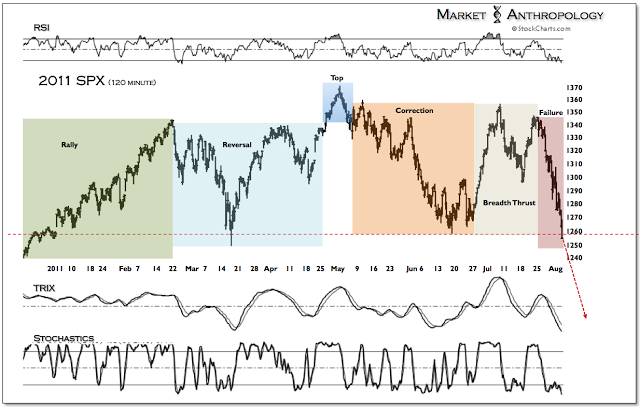
Fig. 5: SPX 2011 (120 Minute)
These examples, both the 2011 low and retracement rally - as well as the broader structure of both QE programs, are representations of a market's scale invariance. We incorporate fractal and analog studies within our work not as an act of clairvoyance, but to gain greater perspective. This extends primarily from a belief that market behavior - especially at volatile transitions - reflects persistent patterns, that can provide participants an enhanced outlook. This methodology is based on the notion that participants behavior throughout market history has remained constant and depicted along an emotional continuum that encompasses both rational (i.e. linear) and irrational (i.e. nonlinear) market psychology. It is the self-similarity in price structure that reflects the inherent emotionalities or DNA that can replicate at many different scales, as illustrated in the two examples above.
Like most research approaches, fractal analysis is just a framework that ultimately should be incorporated in a more expansive evaluation of market conditions. From our point of view, although we do not expect a market decline proportional to the full retracement of QE2 in 2011, the broader technical structure that remains under pressure - as well as the underlying policy mechanism that helped drive the rally (Figure 3), leaves us with the impression that bearish scenario A is the most probable outcome.
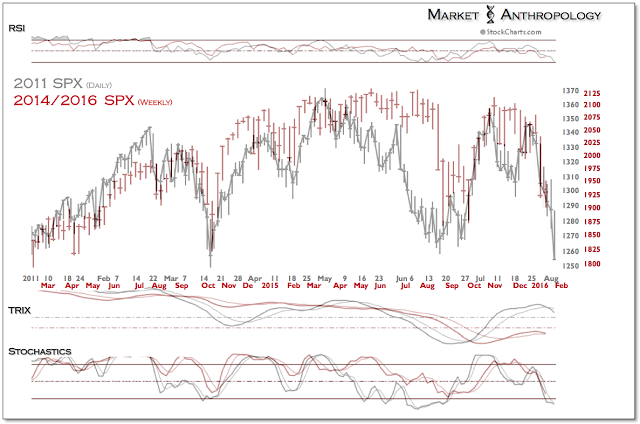
Fig. 6: SPX Daily 2011: Weekly 2014/2016
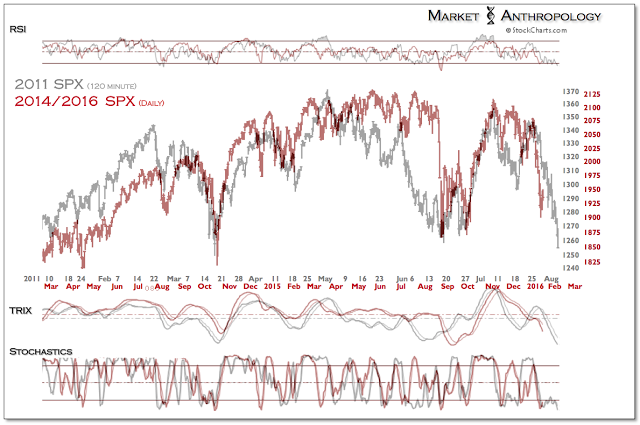
Fig. 7: SPX Monthly 2011: Daily 2014/2016
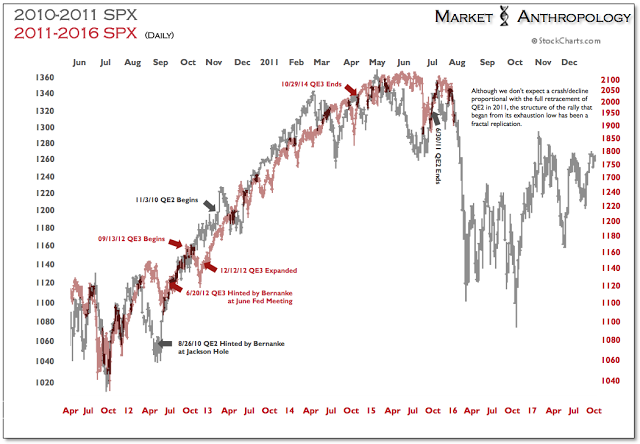
Fig. 8: SPX Daily 2010-2011:2011-2016
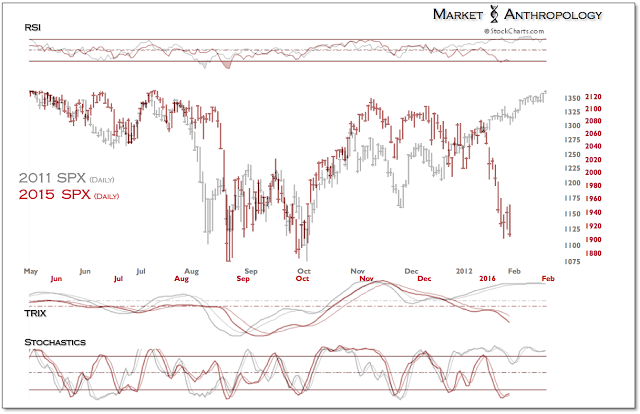
Fig. 9: SPX Daily 2011:2015
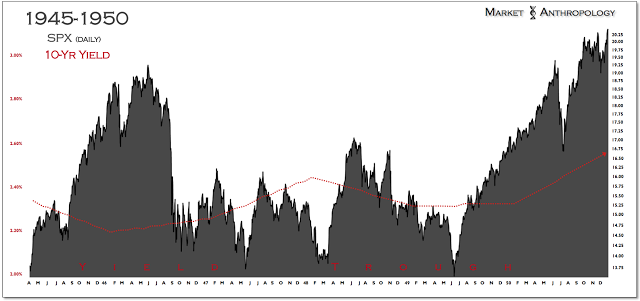
Fig. 10: Daily SPX vs 10-Y vs 1945-1050
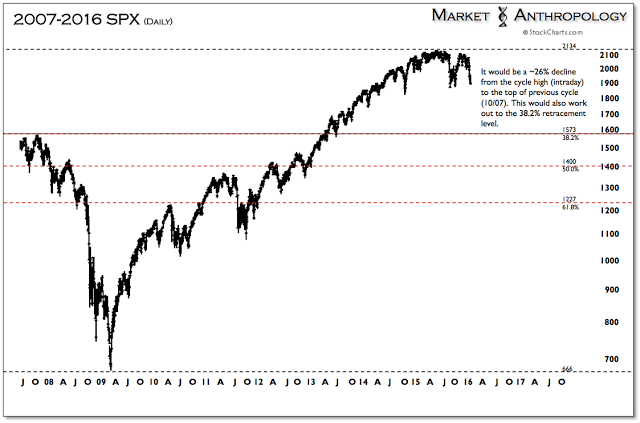
SPX Daily 2007-2016
From: LAURENT CHEKROUN (MAKOR SECURITIES LO) At: Jan 14 2016 07:44:48
Subject: Fwd:FT : WebMD in talks with potential buyers
(James Fontanella-Khan in San Francisco and Bryce Elder and Arash Massoudi in London)WebMD, the US online health information publisher, is exploring the possible sale of all or part of its business, according to people familiar with the situation.The digital company, which provides data and educational information about illnesses, has been in talks with a number of potential buyers, said people close to the company.Walgreens and UnitedHealth are two potential bidders, according to people who closely follow the sector.WebMD and Walgreens already collaborate on a number of initiatives, including a virtual wellness-coaching programme that can be downloaded as an application on smartphones.Shares of WebMD rose nearly 6 per cent on Wednesday in heavy trading. Since the start of the year the stock has risen 10 per cent, giving the company a market value of close to $2bn.People familiar with the situation said WebMD could decide not to do anything after reviewing its options.Last year it hired bankers to explore a sale but later opted to remain independent.WebMD told investors at JPMorgan’s healthcare conference in San Francisco that online traffic during the fourth quarter of 2015 rose 6 per cent year-on-year to an average of 201m unique users per month.WebMD declined to comment on whether it was weighing a sale of its business.