FOR INSTITUTIONAL CLIENT USE ONLY
With Q3 earnings finally under way, this earnings season feels like it is shaping up to be critical for the direction of the broader market heading into the end of the year. The battle of “transitory” vs. “not transitory” continues to rage on with investors slowly leaning more and more hawkish. The headwinds of labor constraints, supply chain bottlenecks and broader inflation have all been well discussed over the past 6 months, yet retail participation and the need for broader institutional investors to keep pace with benchmarks have kept the market near all-time highs for most of 2021. Q3 earnings will give a stronger indication of whether demand dynamics will supersede many of the headwinds that have been flagged by the bears, while also setting the tone for what revisions look like for Q4 and beyond. Ultimately, the second derivative on earnings revisions has slowed, bringing us on a path more normal than we’ve seen over the past 5-6 quarters. With broader valuations seemingly full and continued anxiety around tapering and tightening, the risk to a more challenging “payback” period is the ultimate concern as we finish the year and look forward to 2022.
One of the most notable changes this week was the rally in Unprofitable Tech (MSXXUPT), which ended meaningfully higher despite the move in interest rates. The Growth (MSZZGRW) factor rallied as well this week, consistent with this, in a move that was driven by the strength in Semis and Software. Investors are embracing asset-light software companies that are perceived to be less exposed to supply chain and margin pressures seen in other pockets of the market. Even further, the bulls believe these companies are poised to benefit from customers seeking cost-efficiencies across supply chains.
As we dive deeper into Q3 earnings, earnings reports in the US thus far have been very strong at a high level. Beat rates are above historical averages: currently, 79% of companies that have reported EPS have surprised to the upside, which is above the 8Q average of 76%. Overall, reported earnings growth has come in at +46% which is well ahead of initial expectations for +23% and performance has been strong relative to recent quarters. On average, companies have traded +88bps relative to the SPX during the session after reporting earnings. Companies that have beat on both EPS and Sales have been rewarded with +189bps outperformance over the index after reporting. Although companies are still reporting beats, it feels like the magnitude of these beats is dwindling and guides are coming down (think INTC and SNAP).
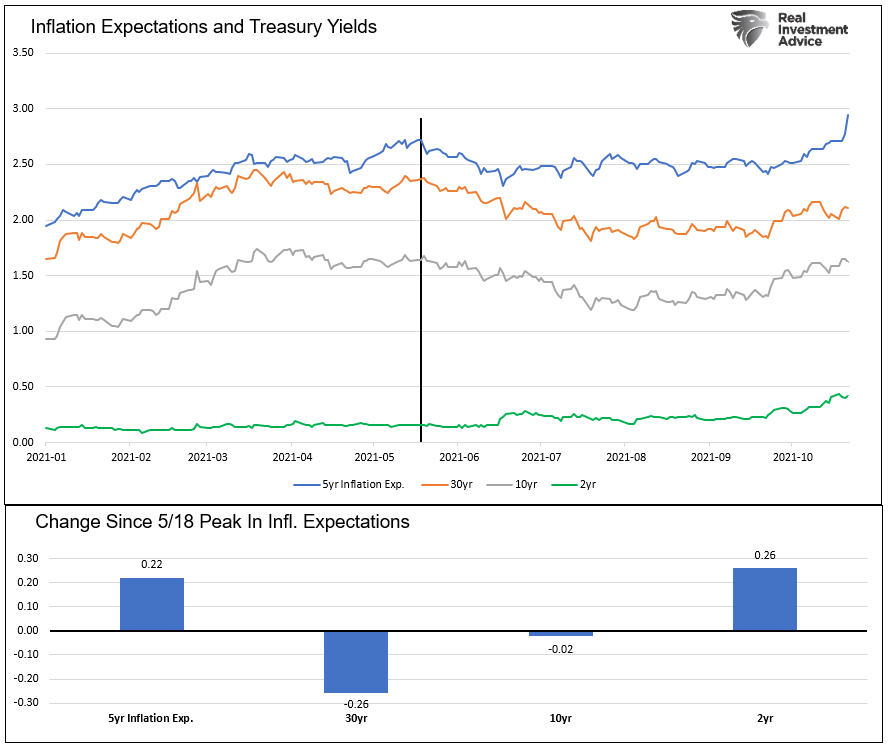
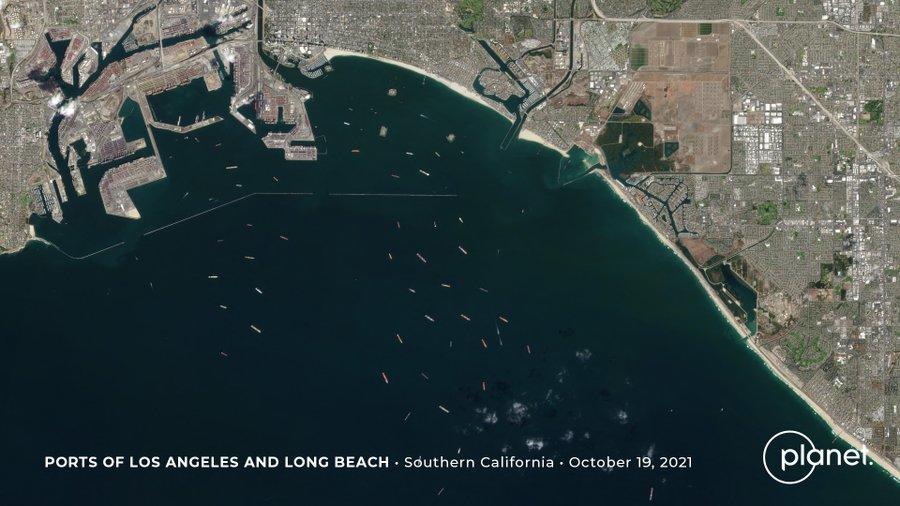
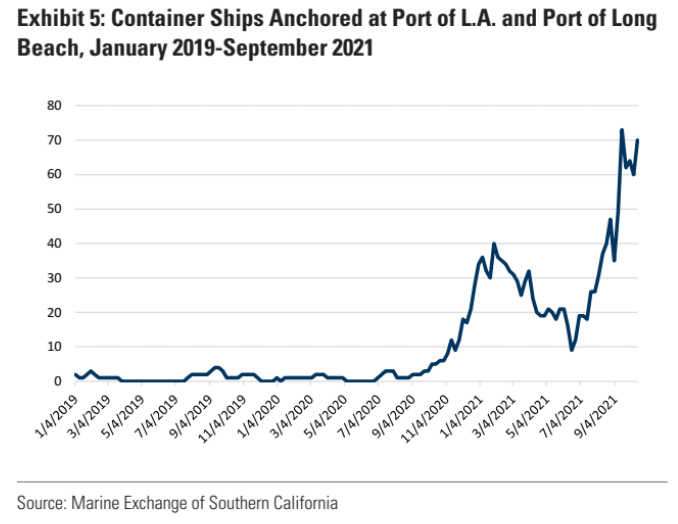
Despite this broader strength in earnings reports thus far, the perpetual head-fake around inflation is front of mind as investors read through company prints to diagnose the severity of margin and supply chain pressures bringing on higher prices. While it’s still early in the season, for example in retail and consumer, it’s clear cost inflation is driving revisions lower. This isn’t a situation where the risk is concentrated either – it’s broad across restaurants, staples, apparel, footwear and household durables are all feeling the pinch. Brinker (EAT), Domino’s (DPZ), Procter & Gamble (PG), Nike (NKE), Pepsi (PEP) and Whirlpool (WHR) have all missed in varying degrees and the reason has been consistent: inflation arising from higher commodity/labor costs or supply chain disruptions. None of this is particularly surprising – we’ve all been talking about inflation / supply chain – but it’s proving to not be fully priced in within this cohort as stocks are going down with the magnitude of the misses being worse than expected, with many of these stocks 10-20% off their highs.
What’s more, Domino’s (DPZ), Procter & Gamble (PG), Nike (NKE), Pepsi (PEP) are “actually” the scaled companies with pricing power or a franchise model (in the case of DPZ) that helps them manage through this inflationary environment better. Others may not fare so well, especially those with company operated models (i.e. more operating leverage like Bloomin’ Brands (BLMN), Cheesecake Factory (CAKE), etc.) or companies that operate in commoditized categories with 1) less pricing power and 2) risk of trade down to private label (e.g. broader HPC & Food Staple names). The bull case is that this is now starting to get priced in following a string of misses and companies are responding by taking price. The ultimate question is when will all this price inflation start slow consumer spending, particularly as we transition away from stimulus. This surely will be a key topic across the world as well as in the US.
Looking ahead, next week marks the busiest week of 3Q21 earnings reports in the US. 46% of the SPX market cap will report 3Q21 earnings and some of the largest companies to report will include Apple (AAPL), Microsoft (MSFT), Amazon (AMZN), Facebook (FB), Alphabet (GOOGL), Visa (V), and MasterCard (MA).
I continue, like many of you, to have a couple observations that crossed my mind this week including…
-
With everyone debating inflation and whether they will have to pay $4 for fries at McDonalds going forward, the SAVONE family movie of the week is “Cloudy With a Chance of Meatballs!”
-
As new shows keep coming out, I find myself wondering if the peak of Squid Game hype is nearly behind us. How NFLX will keep everyone glued to their TVs? Media Analyst Ben Swinburne is out with a note reinforcing his OW thesis so be sure to ask for a copy!
- With the Cowboys resting up on their bye weekend, all eyes in the Savone household turn to the Derby del Sole on Sunday – the infamous derby between Roma and Napoli. Roma is looking to take points from the first place team. Should be exciting. Forza!
-
Foreshadowing Napoli’s descent next week, SNAP dropped 20%+ on a big earnings miss last Thursday. US Internet Analyst Brian Nowak is out with an update on what matters now and how SNAP will recover moving forward. I am thankful for my family’s OurPact app that allows us to control my daughter’s screen time on Snapchat.
- Something out of left field this week was Trump’s new SPAC, DWAC. One of the eye-catching parts of the deal is that the financier, Patrick Orlando, is also the chief executive officer of Yunhong International, a SPAC whose offices are in Wuhan, China.
-
The bull versus bear debate continues to persist. Bulls have been pointing to strong incremental consumer demand and bulls point to margin pressures leading to misses. The ongoing question stands as to which scenario will play out as we progress in 2022.
-
Despite a rocky debut, the New York Knicks managed to pull off the win on Wednesday. Kemba Walker started off the game with a standing ovation and ended it with a warm seat on the bench. This road to the playoffs may be unpredictable... Who do you think wins it this year?
-
Head of our Global Auto & Shared Mobility research team, Adam Jonas, published an article on October 22 placing further spotlight on Tesla. What a world we live in where Elon Musk is the CEO of the most valuable/highest margin major car company in the world. Take a look at thisto learn about the disruption Tesla is causing for Auto legacy players. Adam also had a fascinating note on SpaceX this week so be sure to ask for that as well.
- Fall weather seems firmly with us here in the Northeast US, which is commensurate with baseball. While neither of the New York teams are involved, it seems like an LA/Boston series would garner more interest. Frankly, I hope the opposite occurs.
On positioning, US Equity L/S gross leverage increased 1% WoW, likely due to MTM impacts given both longs and shorts outperformed benchmark indices. Net leverage across US L/S funds was unchanged at 61%, though it did briefly touch a ~3-month high on Wednesday of ~63%. Across other strategies, gross and net leverage across EU L/S funds were more or less unchanged, while Asia fund net exposure increased by ~2% WoW (gross exposure was flat). In the US, clearly old habits die hard: software exposure remains at the 100th %tile since 2010 and the LTM, while Financials exposure remains at the 2nd %tile since 2010. This is surprising given recent commentary on rates…
A data point I continue to follow closely is the ratio of dispersion between sectors vs dispersion within sectors (over the last two weeks) which now sits at the 46th %tile since 2016. This implies dispersion is being driven more by movesbetween sectors than within sectors, suggesting a more single stock driven market recently. While a number near historical medians is not that exciting on its own, I’d note a big shift in this metric: it has fallen dramatically. A few weeks ago, a relatively high proportion of dispersion (86th %tile) in the market was driven by moves between sectors as opposed to within sectors. During earnings, the proportion of dispersion within sectors has risen, which has resulted in the decline of this ratio. Please ask for our work here.
After another tumultuous week, MS Chief US Equity Strategist Mike Wilson highlights that retail proves resilient and buys the dip once again, forcing many institutional investors who share his fundamental views to cover and chase. He also notes the MS business conditions index is foreshadowing further deterioration in the Purchasing Manager Indices that have a highly predictive relationship with equity markets. Meanwhile, he thinks consumer confidence also remains shakier than one might think given their propensity to buy the dip. Mike believes this divergence between markets and confidence must be resolved over the next few months one way or another. Additionally, Mike highlights that all other years where at least 85% of S&P members corrected by 10% or more were also met with an index level correction of at least 10%. On par with his call for services over goods, Mike is adding McDonald's (MCD) to his Fresh Money Buy List and highlights the top performers on the list for this year: Alphabet (GOOGL), Synchrony Financial (SYF) and Simon Property Group (SPG). Please ask for the full report.
As the inflation debate rages, MS Chief US Economist Ellen Zentner highlights wage growth and how it continues to be outpaced by inflation, a relationship that could overall erode consumer buying power. Although for now, the retail sales report for the month of September revealed that consumer spending has remained resilient in the face of Delta, suggesting households are currently better equipped to handle Covid-related complications. With respect to key data points, Ellen expects a 460k increase in nonfarm payrolls (following a softer than expected 194k increase in September), a 0.2 point increase in the Conference Board Consumer Confidence in October, a 1.8%M decline in durable goods orders in September vs +1.8% in August, and 3Q21 real GDP at 2.3% Q/Q annualized growth vs. +6.7% in 2Q21. Inventories are expected to have the largest contribution to growth this quarter (+2.3pp) after shaving 1.6pp off 2Q growth and 3.6pp off 1Q. Lastly, in her most recent piece on global economics, Zentner points out that Global capex surged out of the pandemic, leading the recovery - and the outlook is strong. Her team expect global investment growth at 8.1%Y this year, the highest in our 25-year sample period, followed by 5.3%Y in 2022, supported by strong aggregate demand, low interest rates, and public sector funding infrastructure and green initiatives. Please ask to speak to Ellen and team.
While inflationary themes are prevalent across various pockets in the markets, there are deflationary forces worth noting that are gaining traction. MS EU Analyst Elena Mariani highlights Shein’s success as fast-fashion retailer offering 100% own-brand, and the risks of emerging pure-play online disrupters to the global apparel industry in further increasing competitive pressures. Elena expects this to accelerate the multi-decade trend of price deflation across the industry and higher costs of growth as companies try to remain competitive, putting further pressure on margins and returns. As a result, Elena cuts her forecasts and reduces her base and bear case price targets across the entire spectrum of global apparel retailers by ~15% on average. US names most at risk include Abercrombie (ANF), Stitch Fix (SFIX), Revolve (RVLV), American Eagle (AEO), GAP (GPS) and Urban Outfitters (URBN). Please ask to for the full report or to be connected to Elena and the team.
Looking to Asia, MS Chief Asia Economist Chetan Ahya is constructive on the outlook for the ratio of corporate profits to GDP in India. Chetan believes capex and productivity growth will take the lead as the key drivers of growth in this cycle (as they did in 2003-07), allowing strong rates of growth while keeping macro stability risks at bay. Chetan sees this as a clear inflection in India’s macro environment. Rising capex ratios will significantly lift employment prospects and boost income and consumption growth, creating a virtuous cycle. Chetan expects GDP growth to average 7% in F23-26. MS India Equity Strategist Ridham Desai expects India to enter a new profit cycle, which may result in earnings compounding at 20-25% per annum for the next four years. Please ask to be connected with the team.
Turning to China, MS Chief China Economist Robin Xing highlights that3Q21 GDP growth slipped to +4.9% YoY, which beat MSRe +4.5% but missed market expectations of +5. Property Weakness and Power Cuts still create downside risks to the team’s 4% 4Q21 GDP growth estimate, but Robin believes the government is taking a proactive stance. For the property sector, the PBoC for the first time directly referred to Evergrande on October 15th, saying it is an isolated case and they are working with financial institutions provide support for construction resumption. To ease near-term power outages, the State Council raised the market power tariff ceilings to 20% above the benchmark from 10-15%. Additionally, the PBoC has urged developers to service offshore debt repayments such as repurchasing bonds to help support market sentiment. MS Chief China Equity Strategist Laura Wang believes subdued macro conditions, power shortage, property sales slowdown, and sporadic Covid resurgence are likely to keep pressure on earnings. However, near-term sentiment may rebound further with more supportive messages from policymakers about the property market and power supply. Please ask to be connected with the team.
Looking across the pond to Europe, MS European Equity Strategist Ross MacDonald highlights that 3Q21 results are on track to beat expectations with corporate sales outcomes once again outpacing those of EPS and price action showing a negative skew. As of 10/22 he notes that 3Q results have pointed to a solid breath of EPS beats with a net 37% of stocks beating EPS estimates, a healthy breadth of sales beats at +44%, an index level beat with weighted earnings tacking 11% ahead of expectations and the median stock beating estimates by 7%. Keeping in mind that it is too early to make sector statements, Ross notes that from a style perspective net beats have been most prominent for Value stocks so far. Ultimately, he underscores that price action so far is negatively skewed, but the forward guidance should be the swing factor for price action this earnings season. Among the notable moves on 10/22, it is worth highlighting L’Oreal (OR FP) which is up +6% following a strong Q3 sales print post close, delivering LFL sales growth of 13% well ahead of consensus at +7.6% and MSe at +9.4%. Boliden (BOL SS) is down -5% with company flagging supply chain challenges and inflation pressures leading to ~5% average cost inflation in 3Q21.
Earlier this week, MS GVAT Strategist Amruta Pabalkar and MS Chief Europe Equity Strategist Graham Secker analyzed the impacts of potential US and UK tax hikes on European markets. Amruta and Graham estimate that the hit to aggregate market profits from higher corporate taxes would be modest at this stage with a maximum hit of <2.6% for the UK and <1% for Europe. While the UK tax increase is largely factored in long-term estimates by the consensus, the US tax increase may cause some downside risks: (1) it could impact a broad range of European companies and lead to an incremental tax of €5-7bn (~0.8% to 1.1% of market profits), and (2) it is likely to cost an additional ~£1.6-2.3bn to UK corporates. Please ask to be connected to the team.
With a full schedule of MS conferences in the upcoming weeks, I wanted to a highlight a few, such as the Morgan Stanley Sustainable Investing Summit (Oct 27), the Virtual Insurance Corporate Access Day: Life and P&C (Nov 22), and the Virtual Global Consumer & Retail Conference (Nov 30 – Dec 2). Additionally, our Global Chemicals, Agriculture & Packaging Conference (Nov 9-11) will be a hybrid event featuring an in-person portion on the first day, followed by 2 virtual days. These conferences are always in high demand, so be sure to reach out to your sales coverage for more information. Thank you again to the MS Global Corporate Access team for such great work around the world! Please see below for all upcoming MS Conferences & Events.
Have a great weekend. Drink lots of fluids, take Vitamin C, and make sure to wash your hands!
#FORZA
Nick
*Included in my 2021 Global Ideas Deck. Please ask for the presentation.
Please see below the list of client webcasts MS is hosting over the next few days. Please note, these are widely attended events open to Morgan Stanley’s Institutional and Corporate Client base, and appropriate Morgan Stanley personnel. Webcast link information should not be forwarded or shared beyond intended recipients.
Source: Morgan Stanley US Alpha Team & Global White Phone Teams
Time (EST) |
TOPIC & SPEAKERS |
WEBCAST LINK |
Monday, October 25, 2021 |
9:00 AM |
Morgan Stanley Global Macro Forum: The Retail Bid |
Here |
|
MS |
Andrew Sheets, Chief Cross-Asset Strategist
Mike Wilson, Chief Investment Officer & Chief US Equity Strategist
Chris Metli, Head of US Quantitative and Derivative Strategies
Lisa Shalett, Wealth Management Chief Investment Officer |
|
10:00 AM |
Magnesium: The cog in the supply chain? - Call with an Expert |
Here |
|
Expert |
Werner Jaschinsky, CEO, Remag Leichtmetall |
|
Tuesday, October 26, 2021 |
10:00 AM |
MS LatAm Agribusiness || Sugar & Ethanol Outlook with Adecoagro |
Here |
|
Experts |
Renato Junqueira, Director of Sugar, Ethanol & Energy
Marcelle Correa, Sugar, Ethanol & Energy Commercial Manager |
|
|
MS |
Javier Martinez de Olcoz, LatAm Midcap Lead Analyst
Roberto Browne, LatAm Midcap Analyst |
|
10:00 AM |
Mexico Policy Series: Webcast with Carlos Elizondo |
Here |
|
Experts |
Professor Carlos Elizondo, Political Analyst |
|
|
MS |
Nikolaj Lippmann, Mexico Equity Strategist, Head of Research Mexico
Fernando Sedano, Senior Latam Economist |
|
11:00 AM |
IT Trends from a VAR’s Perspective |
Here |
|
MS |
Katy Huberty, Morgan Stanley IT Hardware Analyst |
|
Tuesday, November 2, 2021 |
9:00 AM |
MSQA: Inside the Mind of an Analyst - Consumer Retail |
Here |
|
MS |
Edouard Aubin, European Brands, Morgan Stanley Research
Maria-Laura Adurno, European Food Retail, Morgan Stanley Research
Kimberley Greenberger, NA Specialty Apparel & Department Stores, Morgan Stanley Research
Lillian Lou, China Consumer, Morgan Stanley Research
Brian Kelleher, Head of Asia AlphaWise Research, Morgan Stanley Research
Albert Lin, US Consumer Equity Specialist Sales, Institutional Equity Division
Reyna Venkat, Thematic Investment Strategist, Institutional Equity Division |
|
Thursday, November 11, 2021 |
8:00 AM |
Morgan Stanley Research Global e-Learning: e-Commerce |
Here |
|
MS |
Brian Nowak, US Internet Analyst
Miriam Adisa, EU Internet Analyst
Gary Yu, China Internet & Telecom Analyst
Tetsuro Tsusaka, Japan Internet & Telecom Analyst |
|
Wednesday, November 17, 2021 - Thursday, November 18, 2021 |
9th Annual MSQA Research and Investment Forum |
Monday, November 29, 2021 |
Morgan Stanley Cryptocurrency vs Traditional Finance |
Tuesday, November 30, 2021 - Thursday, December 2, 2021 |
Morgan Stanley Virtual Global Consumer & Retail Conference |
Tuesday, November 30, 2021 |
8:00 AM |
MSQA: Inside the Mind of an Analyst - Autos |
Here |
|
MS |
Billy Kovanis, US Autos & Shares Mobility Research Analyst
Harald Hendrikse, EU Autos & Shared Mobility Research Analyst
Rikke Jacobson, EU Industrials Specialist Sales
Mark van der Pluym, US Industrials Specialist Sales
Reyna Venkat, Thematic Investment Strategist, Institutional Equity Division |
|
Thursday, December 2, 2021 |
8:00 AM |
Morgan Stanley Research Global e-Learning: Chemicals |
Here |
|
MS |
Vincent Andrews, US Chemicals & Agricultural Products
Charlie Webb, EU Chemicals
Mayank Maheshwari, ASEAN Energy & Materials
Takato Watabe, Japan Chemicals & Textiles
|
|
UPCOMING CONFERENCES –
Please reach out to your sales representative if you are interested in attending any of these conferences.
Oct 27 (New York) I Morgan Stanley Sustainable Investing Summit
Nov 3-4 (China) I Virtual China Materials Symposium
Nov 7-9 (Hollywood) I 2021 EEI Financial Conference Meetings Hosted By Morgan Stanley
Nov 9-11 (New York) I Global Chemicals, Agriculture, and Packaging Conference
Nov 17-19 (Barcelona) I European Technology, Media & Telecom Conference
Nov 17-19 (Singapore) I 20th Asia Pacific Summit
Nov 22 (New York) I Virtual Insurance Corporate Access Day: Life and P&C
Nov 30-Dec 2 (New York) I Virtual Global Consumer & Retail Conference
Nov 30-Dec 3 (London) I Virtual Nasdaq Conference
Dec 1-3 (Tokyo) I Inaugural Virtual Japan ESG Conference
Dec 7 (London) I Business Services, Leisure & Transport Corporate Access Day
Dec 7 (New York) I Virtual China New Economy Summit
Jan 4-6 (China) I Virtual China New Economy Summit
Jan 12-14 (New York) I Virtual 14th Annual Latin America Executive Conference
Jan 18 (Asia) I Virtual Asia Symposium
Mar 7-10 (San Francisco) I TMT Conference
Mar 15-17 (London) I European Financials Conference
Mar 22-24 (Hong Kong) I Virtual Hong Kong Summit
The following comments are a summary of Morgan Stanley Research by Morgan Stanley Equity Sales & Trading:
SELECT COVID VIRUS AND TREND FOR RE-OPENING DATA POINTS
Global – Biotechnology – COVID-19 Outbreak Dynamics
US – Retail – Total Discretionary Retail Traffic
MS BROAD TRENDS & INFLECTION POINTS
Positive
ìîUS – Equities – Baskets and Indices Performance
ìGlobal – Global Risk Indicators – % Change
ìGlobal – Oil – Global Oil Supply Likely To Peak Earlier Than Demand; Raise Brent Forecasts
Source: IEA, Morgan Stanley Research
Martijn Rats highlights that despite efficiency efforts, energy consumption will still likely grow from ~600 EJ today to ~740 EJ by 2040. He notes that oil accounts for ~31% of primary energy supply, but its share of energy supply growth is already lower at ~20%, and falling by ~0.5% per year. Martijn assumes this will continue, and then treats the electrification of transportation as a separate additional headwind. On these assumptions, he thinks oil demand peaks at ~105 mb/d by late/end of this decade. He thinks investment is already consistent with 'Net Zero', likely causing a peak in supply mid-decade. If capex stays stable at current levels, Martijn believes global oil supply will likely roll over around 2024 and then decline sharply thereafter. Unless more investment is forthcoming, or major demand break-throughs are made, he notes that oil prices will likely search for the level where some demand erosion kicks in. Martijn raises his 1Q22 Brent forecast to $95/bbl and his long-term forecast from $60 to $70. Download the Complete Report
ìîAsia – Cross Product –Quick Statistical Comparison Between A50 & MSCI A50
Source: MSCI BARRA, Bloomberg, Shanghai Exchange, Shenzhen Exchange, HKEX
MSCI China A50 Connect Futures launches TODAY in HKEX, these will track MXCNA50C, a competing product to XUA listed in SGX (FTSE China A50). Key differentiation of this index creation vs the existing SGX China A50, is that it will be more sector-neutral versus the A50 version, which has been pure free-float market cap weighted. MS Futures will be ready from Day 1 to support agency / electronic orders and clearing and MS Options from day one will be quoting OTC options (there won’t be listed options). Please refer to attached email from our cross products team for more details. Related notes on SGX / HKEX below. Download the Complete Report, Download the Complete Report, Download the Complete Report, Download the Complete Report
ìUS – Defense – Report Of China’s Surprise Hypersonic Test; Overweight NOC
Source: Stockholm International Peace Research Institute (SIPRI), Morgan Stanley Research
Kristine Liwag highlights that Defense is relatively cheap, trading at a 16% discount to the S&P 500. She notes that this discount suggests the market is pricing in budget pressure concerns for President Biden’s FY23 Defense Budget request with a Democrat-majority Senate and House of Representatives and a Democrat-President.Kristine believes reports of China’s recent test of a nuclear-capable hypersonic missile may spur accelerated funding for U.S. hypersonics efforts. She thinks this provides a floor for defense, which supports her attractive view on the sector. She sees Northrop Grumman (OW, $478 PT) as the stock to own given its portfolio’s alignment to DoD’s highest-priorities areas, including the nuclear triad, space and hypersonics. She also notes that LMT (OW, $458 PT) is the prime beneficiary of increased DoD spending on hypersonics. The company expects $1.5bn in hypersonics revenues this year, up from $1.2bn in 2020, and suggested hypersonics revenues could double to $3.0bn by the middle of the decade. Download the Complete Report
ìUS – Software – Security CQ3 Preview; A Rising Tide Lifts Nearly All Boats
Source: Morgan Stanley Research
Hamza Fodderwala highlights that security demand continues to strengthen and is likely in the early innings of an up-cycle. His latest checks remain supportive of positive demand trends heading into Q3 prints, with early signs of strong pipeline build in Q4. In particular, he sees stronger upside from the Q3 Federal budget flush, with a number of large Federal security resellers citing >20% YoY increase in bookings. He thinks this should benefit several security vendors. On names with the most favorable setups into the print, Hamza highlights: 1) TENB (OW, $67 PT), where he thinks improving demand in Q3 has the potential to drive a more sustained re-rating; 2) SAIL (OW, $75 PT), where he sees strong checks and continued execution at a bargain; and 3) VRNS (OW, $65 PT), with secular trends around digital transformation/remote access as well as increased compliance requirements driving strong long-term growth tailwinds. Into the print, Hamza is more cautious on QLYS (UW, $100 PT) and CHKP (UW, $114 PT). Download the Complete Report
ì China – Strategy – Historical China HY Property Sector Defaults And Defaults Priced In By The Credit Market
Source: Bloomberg, Morgan Stanley Research; Note: Pricing as of October 15, 2021. Market priced-in refers to China HY property credit bonds outstanding that are trading below 30 cents.
Kelvin Pang is turning bullish on China HY / China HY Property as valuation has cheapened up and is pricing in significant downside risk with no expectation of easing vs. our policy easing expectations. Reminder Elly Chen upgraded China property sector on equity side last week, seeing policy has bottomed. He thinks that this pricing is unrealistic, as the credit market is expecting regulators and local governments to not support the China property sector at all and let the default rate for the sector go up as high as 45%. In addition, he believes that demand technical will be supportive for China HY, despite the recent significant underperformance from the asset class. 2 key trades that Kelvin likes: 1) Prefer China HY over China IG; 2) Risk/reward favours long-end China HY property single B credits. Download the Complete Report
ì Asia – Economics – India's GDP to exceed its pre-Covid path from 3Q21
Source: CEIC, Morgan Stanley Research forecasts. Note: The pre-pandemic path refers to the expected trajectory based on average %Q growth rate for 2019
10 years of policy missteps and exogenous shocks will surrender to a nascent shift, whereby Chetan calls for the dawn of a new cycle, with characteristics akin to the ’03-’07 cycle. According to Chetan a virtuous cycle, supported by strong capex and productivity, is taking off in India. The past decade was challenging following domestic policy choices like taking up currency replacement (“demonetization”), GST reform, overlaying this was a global environment which was hardly supportive, with deleveraging headwinds first in DM and then in China, as well as the onset of trade tensions and the Covid shock. However, now the policy intent has clearly shifted to boosting corporate earnings and drive investments. Our equity strategist for India, Ridham Desai, expects India to enter a new profit cycle, which may result in earnings compounding at 20-25% per annum for the next four years. Strong rates of growth (for GDP growth we’ve penciled-in +7% GDP growth per annum (FY23-26) vs. +4.8% pre-Covid), coupled with benign macro stability risks, set a positive backdrop for the ratio of corporate profits to GDP to rise to 3.5% vs. now<2% and peak 7-8%. Download the Complete Report
ì Asia – Refining – Valuations compelling despite upside triggers from easing travel restrictions
Source: Refinitiv, Morgan Stanley Research
Mayank Maheshwari sees refining margins inflecting along with demand normalisation especially for diesel & jet fuel and see the recent improvement as the start of an upcycle that will last for the next few years. Permanent supply shutdowns (~4% of global supplies), low inventory levels (5-yr lows) combined with improving demand should support utilization rates as well as margins, resulting in a ~10% EPS upside and ~17% upside for our top OWs: S-Oil, HPCL, RIL, PTTGC, FPCC, and Ampol. Preferred markets are India and Korea, given they are undergoing hardware upgrades. Thailand refiners give you higher earnings sensitivity so can be a better levered plays. Valuations have risen to cycle averages despite much stronger industry dynamics. Yet, Mayank sees stronger FCF and earnings upgrades driving stock performance from here. China remains our least preferred market on still-low utilisation rates and concerns around price controls. Oil - Martijn Rats lifts his long-term oil price forecasts from US$60/bbl to US$70/bbl, calling for US$95/bbl in 1Q22, as his S/D analysis factoring in the IEA's 'Net Zero' scenario indicates global oil supply is likely to peak even earlier than demand. Download the Complete Report | Download the Complete Report
ìî LatAm – LatAm Proteins – China Update – Big Numbers For Beef, And Brazil Matters
Chinese local protein prices
Source: China Customs, Morgan Stanley Research
MS LatAm Research Analyst Ricardo Alves highlights that China Sept. beef imports reached an all-time high with prices accelerating further. Imported volumes from Brazil also set a new record, now 46% of total shipments. On one hand, the data suggests China may have stocked up some beef; on the other, it underscores the importance of Brazil as a supplier. Download the Complete Report
ìEurope – Oil & Gas – On current trends, global oil supply is likely to peak even earlier than demand. As prices search for the level at which demand erosion kicks in, MS Equity Analyst and Commodities Strategist Martijn Rats increases his 1Q22 Brent forecast to $95/bbl, but also lifts his long-term forecast from $60 to $70/bbl. Download the Complete Report
ìEEMEA – Financials – Core Loan Growth
Source: SARB, RMB Morgan Stanley Research
South African loan growth (2.2% y/y) began accelerating led by ABG (7.3% y/y) and SBK (5.8% y/y) while NED (-2.7% y/y) lagged. System deposit growth (4.3% y/y) was led by CPI (12.9% y/y) as NED lagged (-1.0% y/y). System provisioning is flat since June 2021, though increased m/m for NED and CPI.Download the Complete Report
ìî LatAm – Global Pulp & Paper – MS LatAm Research Analyst Carlos De Alba highlights new pulp capacity additions to hit the market in '22/23 are sparking concerns that an oversupplied market could lead to significantly lower pulp prices ST. Yet MS analysis shows pulp prices tend to rise, not fall, amid material capacity and production increases. Remain OW SUZ, KLABIN, CMPC & COPEC. Download the Complete Report
ìASEAN – Financials – Financial metrics before, during and after Covid
Source: BI,Company Reports, Morgan Stanley Research. Fees, non-NII, CIR, credit charges data and deposit growth in 2022e are the average of the big four banks
Selvie Jusman published an Insight report on Indonesian banks. The structural story of the economy remains intact and is supported by the backdrop of rising energy prices (each 10% rise in energy prices improves Indonesia's current account balance by 0.3ppt of GDP). Capital inflows from September indicate an inflection point, and banks, often seen as macro-related proxies, are set to benefit. Furthermore, we expect rate hikes in Indonesia to be non-disruptive and only to rise in 2Q22. Indonesian banks' share prices have only risen +4.6% YTD, lagging regional peers in Singapore, +15.2%, and India, +13.9%. BCA has outperformed in this cycle, which makes sense given its defensive earnings and consistently lower historical credit risks. Now we believe its shares have largely priced in the RoE recovery ahead of peers, and we downgrade to EW. As the cycle turns expansionary, we prefer BRI, BNI (upgrade to OW) and Mandiri. Furthermore, Mandiri and BNI are still trading at a significant discount to 2019 levels, 8% and 16%, respectively, compared to 1% below for BRI and 12% ahead for BCA. Download the Complete Report
ìî LatAm – Global Pulp & Paper – MS LatAm Research Analyst Carlos De Alba highlights new pulp capacity additions to hit the market in '22/23 are sparking concerns that an oversupplied market could lead to significantly lower pulp prices ST. Yet MS analysis shows pulp prices tend to rise, not fall, amid material capacity and production increases. Remain OW SUZ, KLABIN, CMPC & COPEC. Download the Complete Report
ì LatAm – Latam Retail & Ecommerce – 3Q21 Results – Key Takes For Liverpool And Carrefour Brasil
MS LatAm Research Analyst Andrew Ruben highlights that Liverpool's recovery continued, with revenue +6% above 3Q19 levels (in-line with MSe), while EBITDA margins were an upside surprise, in part from credit provisions. For Carrefour Brasil, sales were +3% above MSe, with Atacadao upside but y/y declines in Carrefour Retail comps and eCommerce GMV. Download the Complete Report
ìîS.Korea – Technology – Korean Cathode Material Makers' (Bm, L&F, Posco Chemical) Capacity Vs. Korean EV battery makers' GWh capacity
Source: Company data, Morgan Stanley Research (E) estimates
Korea EV materials names got hammered today on the news that Tesla investor stated on its 3Q earnings investor deck that it is "shifting to Lithium Iron Phosphate (LFP) battery chemistry globally. Discussions around LFP vs. NCM/NCA is nothing new. Despite some benefits of LFP, companies think it has clear limits in competing with nickel-rich cathode from a technology point of view. Ryan Kim sticks to his bullish view and would accumulate on this correction. He recently had a piece out raising earnings/PTs by average 60% across the board. Despite YTD outperformance, Ryan believes the best is yet to come as continued capacity additions in conjunction with battery suppliers’ order wins and binding contracts allow strong earnings visibility. Meanwhile, contrary to market concerns about potential cathode oversupplies, his supply/demand analysis indicates that Korean material makers’ cathode capacity targets by 2025 is only able to meet 63% of total demand by top 3 Korean EV makers. Following Korea battery makers’ recent JV announcements with Stellantis, Ryan expects newsflows/announcements related to cathode/copper material orders to support shares. Based on market expectations of 250-260GWh battery orders from this JV, he estimates 300kt cathode capacity may be needed, substantially above Ecopro BM’s 2025 capacity targets. Stock specific catalysts to watch in the near-term include – 1) Ecopro BM: potential mid/long-term plan update at the conference in early Nov, 2) L&F: potential additional order wins from SK Innovation, and 3) Solus – new copper foil capacity addition in Europe. Ecopro BM and L&F remain Ryan’s top picks.
-
Korea Auto Parts – reminder Young Suk Shin’s bullish view on Auto parts to start outperform OEMs now given its higher leverage to auto production normalization and eventual inventory restocking. We upgrade d Hyundai Mobis and Mando to OW, and Hanon to EW, while keeping OEMs at EWs.
Download the Complete Report | Download the Complete Report | Download the Complete Report
ì LatAm – Sugar & Ethanol – 2021/22 Outlook – Still Upside In Commodities; Agro To OW
S&E stocks are more correlated to sugar prices than to the overall market and may offer protection in a downturn; AGRO lagging in spite of strong outlook (USD performance, -5Y=100)
Source: Datastream, Morgan Stanley Research
MS LatAM Research Analyst Javier Martinez is more bullish on sugar and expect prices to continue to rally and reach $22c/lb in 2022, as weather affects the Brazilian supply, higher Brent incentivizes ethanol production and cane/beets lose acreage to more profitable crops. In this context, AGRO is his Top Pick and he upgrades it to OW. Download the Complete Report
ì LatAm – Latam Agribusiness – Higher Brent To Drive Sugar And Grain Prices Up
Brent prices drive sugar and pose upside risk to our sugar price outlook
Source: USDA, Morgan Stanley Research estimates.
MS oil strategists and MS LatAm Research Analyst Javier Martinez have become more bullish and now forecast Brent peaking at $95/bbl in 1Q22, then heading to $85/bbl by 4Q22. This lifts ethanol and other biofuel price expectations. The impact is clearer on sugar, as incentive prices reach over $22c/lb in 1H22, but also positive for grain prices. Download the Complete Report
ìChina/Hong Kong – Consumer - According to Terence Cheng’s latest discussions with OEMs, many apparel and footwear makers have accelerated production resumption in southern Vietnam in the past 10 days as local authorities have loosened in approvals of resumption plans applied by OEMs. Major apparel OEMs now have most of their plants at capacity utilization rates of 40-70%+ and aim to have most of them to be back to 70%+ by end-October vs. the prior targets of 30-60%. Major footwear OEMs now have most of their plants at utilization rates of 40-50%, and some auxiliary suppliers are at ~80% now. That's above prior end-October targets, and it looks like 80-90% by end-November is achievable. His top picks for apparel OEMs are Eclat, Shenzhou, and Makalot. Top picks for footwear OEMs are Huali, Feng Tay, and Stella.
Download the Complete Report
Negative
îìGlobal Apparel Retail – Shein Disrupting Fast Fashion; Downgrade Boohoo & H&M to Underweight
Source: Similarweb, Morgan Stanley Research estimates
Elena Mariani, Kimberly Greenberger and the global retail team highlight that largely inexistent 8-9 years ago, Shein has now become one of the largest apparel players globally, with an estimated >$10bn revenues per annum (>100% CAGR over the past eight years). With barriers to entry getting lower, the team sees the apparel market as incrementally more vulnerable. The team expects further price deflation and higher cost of growth ahead for the apparel industry. The team cuts its forecasts across the entire spectrum of global apparel retailers, reducing base and bear case price targets by ~15% on average. Among European names, the team sees the greatest risk to Boohoo (BOO LN, GBp229 PT) and H&M (HMB SS, SEK140 PT)—both downgraded to UW, although the team also reduces forecasts for ASOS (ASC LN EW, GBp3300 PT), Zalando (ZAL GR EW, €95 PT), GFG (GFG GR EW, €12 PT), Inditex (ITX SM EW, €29 PT) and ABF (ABF LN OW, GBp2500 PT). Among US names, the team thinks Shein could most threaten future revenue gains at Abercrombie (UW, $30 PT), Stitch Fix (UW, $27 PT), Revolve (EW, $45 PT), American Eagle (EW, $27 PT), GAP (EW, $25 PT) and Urban Outfitters (OW, $41 PT) – underpinning the team’s below-consensus estimates and further earnings cuts.Download the Complete Report
î US – Steel Playing Post-Peak Steel; Downgrade Industry to In-Line
Source: Steel Market Update, SBB, Morgan Stanley Research
Carlos de Alba is revising his industry view to In-Line, as he thinks the prospects of lower steel prices will continue to broadly weigh on the stocks. Despite solid free cash flow generation, compelling dividend yield and relatively attractive valuations on his 2022 estimates, Carlos thinks that the steel stocks will trade below their intrinsic value as long as steel prices trend downwards. He is double-downgrading X to UW as he thinks the company is still in the early innings of a significant investment cycle, which will dampen FCF generation for the next few years. His new PT of $17 implies 21% downside. Carlos is also downgrading STLD to EW, with a new PT of $61, as he thinks market-related concerns will dominate sentiment in the near term. He recommends awaiting a better entry point. On a relative basis, he prefers names with higher free cash flow yields over the coming two years. Hence, at this time in the cycle, he favors STLD over NUE (EW, $105 PT), and CLF (EW, $21 PT) over X. Carlos sees steel prices peaking in 4Q21 and now expects HRC to average $1,800/t in 4Q21 (vs. $1,850/t previously) and $1,100/t in 2022 (from $1,145/t). Download the Complete Report
î ASIA – Technology – Order Of Preference
Source: Refinitiv, Morgan Stanley Research
Shawn Kim and Shoji Sato-san turns more cautious on MLCC space. MLCC group has derated since September as the industry over-shipping has outstripped demand since then, however P/B and EV/sales multiples are still above +1 S.D. Team reversed their view on Asia MLCC space turning more bearish on Japan MLCC names over Taiwan name (Yageo) as excess is most problematic at the high-end (automotive) now, while a lot of bad news are in the price for Taiwanese players. The team now forecast MLCC market to grow +2% YoY in 2022 (vs prior +9%), a sharp deceleration from +23% YoY in 1Q21. Our analysis indicates that aggregate automotive MLCC shipment up 2.3x in both Mar and Apr-Jun 2021 relative to the 2017 quarterly average. This compares to a 10% decline in global passenger vehicle shipment over the same period and speaks to growing risk of inventory adjustment. With MLCC in its second quarter of organic growth deceleration vs typical 4 quarter duration of a downcycle, our analysts see a period of consolidation ahead for MLCCs and stay sidelined. Sato-san makes meaningful cuts to Japan MLCC forecasts and downgrades Taiyo Yuden to UW from EW and Murata to EW from OW. Download the Complete Report |Download the Complete Report | Download the Complete Report |Download the Complete Report
îìEurope – Metals & Mining – Helped By A General Trend Of Rising Real Rates
Source: Bloomberg, Morgan Stanley Research
MS Research Analyst Dan Shaw estimates that gold equities are discounting a price c.10% below current spot, and are ascribing little probability to a possible inflation/stagflation driven bull case. This offers some optionality for equities. However, his base case of a stronger USD/higher rates remains a headwind near term.Download the Complete Report
î Asia – Technology Semiconductors – NOR Flash pricing trend
Source: Gartner, Morgan Stanley Research (E) estimates
MS house view has been cautious Memory. However Shawn is reiterating his bearish view, despite the share prices peaked already 6M ago and the past typically experience of corrections lasted ~6-9M, Shawn takes stock and thinks it is still too early to buy the dip. His checks indicate that demand and inventory conditions have worsened in recent weeks, leading to a further downturn in pricing expectations into 2022.. Regarding NOR Flash Daniel Yen further downgrades all NOR Flash vendors one notch rating – Macronix, Winbond to UW and GigaDevice to EW, as weaker-than-expected 4Q pricing (flat to up QoQ) combined with weak demand end conditions in PC, smartphones, TV; implies limited pricing upside in 2022. This, combined with GigaDevice’s technology migration from 65nm to 55mn means more output at a time when demand is softening, keeping the inventory level at high levels. All in, Daniel remains long-term constructive on NOR given content increase but think the stocks are not immune to cyclical headwinds. He sees significant NOR pricing correction in 1H22 to compress the valuation multiples for both Macronix (currently 1.6x P/B) and Winbond (1.3x P/B) toward 1x P/B level. Daniel remains sidelined. Download the Complete Report |Download the Complete Report
MS SINGLE NAMES CONTENT
Positive
ìUS – PayPal & Pinterest – James Faucette and Brian Nowak highlight that PYPL (OW, $340 PT) could be evaluating a purchase of Pinterest (OW, $77 PT) in a deal valued at $39B, according to reports by Bloomberg News. The team notes that an announcement could be made in time for PYPL's earnings release on November 8, though deal terms may change. James thinks the potential combination could help PYPL expand strategic engagement with merchants as it can leverage PINS' platform to boost sales discovery of merchants’ products, though it would likely require some heavy lifting from PYPL to meaningfully accelerate merchant engagement through the new channel. PYPL isn't an accepted payment method on PINS' platform, but James assumes there is already notable overlap between the companies’ US merchant partners, given PYPL’s 80% acceptance share in the market. Brian notes that the reported potential acquisition re-affirms his macro view about the rising long-term importance of social commerce and the social commerce optionality on PINS. Download the Complete Report
ìChina – Ping An Bank – PAB's strong 3Q21 profit beat featured healthy revenue and PPOP growth as well as lower credit cost. Richard believes proactive risk booking, expanding client base, and investment in fee business could continue to drive future growth. Richard expects share price to rise in absolute terms in the next 60 days because of strong 3Q21 earnings release. The stock has also traded off in recent months due to concerns on property market risks, which he also believes will abate over time.Download the Complete Report
ìîUS – Five9 Inc – Opportunity Set Intact; Fewer Unknowns; Upgrade to Overweight
Source: Morgan Stanley Research
Meta Marshall thinks FIVN’s growth prospects are unhampered by the dissolution of the ZM/FIVN merger agreement, and upgrades the stock from Equal-weight to Overweight. FIVN remains the cleanest positioning of the public names and competes in the most attractive portions of the market, but this success is likely to draw more investor conversations around the competitive landscape. Despite the recent selloff in software, the high growth comparables still trade at ~0.55x EV/ Street ’23 Sales/g (0.45x for overall software embedding conservatism in high growth estimates). This would imply ~14-18x EV/'23 Sales/g valuation for FIVN, vs. shares trading 3-4x below this today. As valuations recover in comm software, there could be an accompanying rise in FIVN’s valuation as chance of strategic activity increases. Meta’s unchanged $200 price target now represents 14x EV/23 revenue assuming 31% '21-23 growth CAGR (~17-18x Street – in line with high growth multiples). Download the Complete Report
ìUS – Netflix Inc – Ben Swinburne highlights that for the first three quarters of 2021, Netflix (OW) customer growth looked decidedly un-Netflix like. Assuming it delivers on or around the 8.5mm 4Q net additions guidance and following a stronger than expected 3Q21 net adds, he thinks it looks decidedly back on track: That is to say that the financial algorithm of mid-teens revenue growth, 300bp +/- margin expansion, and rapidly ramping FCF has gone from the stretch case back to the base case. Ben’s 35-40% EPS CAGR supports the premium multiples that his $700 price target and $900 bull case reflect. Beyond the stronger base business outlook, he thinks there remain cheap call options on gaming, consumer products, and franchise development. Ben also notes that higher subscriber growth in 3Q (+4.4mm net adds vs. MSe/guide of +3.5mm) benefited from particular strength in EMEA and APAC, which together represented over 90% of the quarter's net adds. Additionally, for 2020 and 2021E in aggregate, Ben believes Netflix is still on track to deliver ahead of its ~300bp average annual margin expansion target (up over 500bp in '20, and on track to deliver +200bp or better in '21).Download the Complete Report
ìUS – Zynga Inc – Key Positive Developments Since 2Q, Important Near-Term Catalysts
Source: Thomas Reuters, Morgan Stanley Research
Matt Cost highlights that when ZNGA reported 2Q results on 8/5, it lowered full year bookings guidance by 3% ($100mn) as it reported unexpected weakness and churn in many titles during June/July, which it was unable to offset with paid UA due to IDFA-related disruption in the marketing ecosystem. He notes that this left investors with a series of questions about the impact that the iOS (Covered by MS Research Analyst Katy Huberty, AAPL OW, $168 PT) privacy changes and post-COVID reopening were having on ZNGA's business. While ZNGA shares have materially underperformed following 2Q results, Matt believes that the market has more than fully priced in the potential negative impacts of weaker marketing/higher churn through 2021. He sees multiple signals that the company may already be emerging from the worst of the recent headwinds, but notes that ZNGA is currently trading at more than 2 standard deviations below its average EBITDA multiple over the past 5 years (i.e. the entire tenure of the current management team). While he fully acknowledges that it will take time to build back confidence (and the multiple investors will pay), he sees potential drivers of upside in the near-term. Matt remains OW and reduces his PT to $10.50 (~40% Upside). Download the Complete Report
ìUS – Tesla Inc – Adam Jonas highlights that Tesla (OW, $900 PT) posted a surprising 23.3% Adjusted EBITDA margin thanks to a YoY variable 37% auto gross (ex ZEV). He also believes the 28% incremental adjusted auto EBITDA margin YoY is a decent proxy for the profitability of the Shanghai plant and the Model Y which is clearly positive for margins. Additionally, Adam believes Tesla is in position to ‘invest’ its margin and cost reduction into lower ATPs for its vehicles. Adam thinks a key goal of Tesla is to reduce the price point of its entry-level vehicles to well under $20k/unit, possibly lower. He sees a major opportunity for Tesla to challenge current investor thinking around its growth and profitability once the company ‘turns on’ its 2 newest factories currently nearing completion with pre-production units by year-end in Texas and Berlin. While admittedly it may be hard to move the needle too much on the newest ‘Teracap’ name, Adam believes the launch of Tesla’s telematics insurance product in Texas early this month has the potential to disrupt the auto P&C industry and could pave the way for OEMs to capture a recurring revenue opportunity while offering consumers a competitive and dynamic alternative insurance experience. Download the Complete Report
Negative
îìUS – Snap Inc – IDFA & Macro Headwinds; Stay Overweight
Source: Company data, Morgan Stanley Research
Brian Nowak highlights that SNAP’s (OW, $85 PT) disappointing 3Q revenue (~$1,067mn - 6.6% below MSe) and 4Q revenue guidance ($1,205mn at the top end ~20% below his previous estimate) speaks to greater than expected iOS (Covered by MS Research Analyst Katy Huberty, AAPL OW, $168 PT) measurement and attribution related challenges. Brian had sized SNAP’s estimated IDFA exposure and laid out multiple reasons why he thought it would be relatively manageable. But 6 of the 8 factors he thought would help SNAP navigate through IDFA challenges have proven to be less effective than hoped (at least as of now). Notably, many of these are SNAP-specific executional challenges, as (in his view) SNAP’s 50%+ DR exposure (a majority of which he estimates is app installs) and slower than expected execution on alternative measurement tools (such as Advanced Conversions and Estimated Conversions) combined with a smaller advertiser base are creating more disruption that SNAP needs to execute through. Brian doesn’t expect these challenges will be fixed overnight either, as it will likely take time (months or quarters) for SNAP to fully roll out these tools to advertisers and for advertisers to learn to use them and optimize spend. He thinks that this, along with current macro supply chain challenges, creates an unfavorable operating environment for SNAP and ultimately calls into question the achievability of the 50%+ multi-year revenue growth outlook. In terms of reads across, Brian thinks GOOGL (OW, $3000 PT)/U (Covered by MS Research Analyst Matt Cost, EW, $120 PT)/APP (EW, $80 PT) are cleanest and FB (OW, $400 PT) is still positioned to outperform. Download the Complete Report
îLatAm – Latin America Steel – MS LatAm Research Analyst Carlos De Alba sees steel prices in the Americas declining from current peak levels and downgrade CSN, TX & GGB to EW. Despite solid free cash flow generation, compelling dividend yields and relatively low valuation, he thinks these stocks will trade below their intrinsic value as steel prices trend down. Download the Complete Report
îUS – Virgin Galactic Holdings Inc – Kristine Liwag highlights that after digesting last week’s news of the flight delay for Unity 23, she has been fielding calls from investors about what’s next for SPCE in the coming months ahead. Considering that Eve (mothership) will be grounded for its 8-month enhancement period ending ~June 2022 at the earliest, she does not see any meaningful positive catalysts for the stock until then. To the contrary, she sees a potential negative catalyst on the horizon for the stock as the lock-up period for ~28% of shares outstanding ends on October 25, 2021, potentially furthering near-term pressure on the stock. Additionally, her biggest takeaway from the delay of Unity 23 and the long enhancement period for Eve is that commercialization and high volume operations could take much longer than the company initially anticipated. She is changing her model to shift more flights to the right as she accounts for additional delays. Kristine lowers her PT from $25 to $17 and reiterates her UW rating. Download the Complete Report
îUS – Intel Corporation – Joe Moore downgrades INTC to EW. He highlights that the situation is mixed, but ultimately the capital spending requires underwriting a growth forecast that seems challenging. He believes Intel ($55 PT) is on the brink of a product turnaround, as Alder Lake performance should position the company to regain share in the high end of the consumer PC market, and reiteration of timing on Sapphire Rapids is a key positive around a product that should help them to stabilize server share long term (though he still expects share loss in 2022 with stabilization in 2023). Further, while Joe is mildly disappointed by the guidance for next year's gross margin to fall to 51-53%, he thinks investor sentiment was already there, and he expects that number to be conservative. The challenge for Joe, though, is that capital spending of $25-28 bn in 2022 - moving higher in future years - reduces free cash flow to about the level of the dividend (which the company said will rise over time), implies a steep ramp in ongoing fixed costs beyond CY22 - and may be just the beginning. Download the Complete Report
îLatAm – Mexico Strategy & Economics – A constitutional change that would allow for a reversal of decades of private energy investments in Mexico is not MS LatAm Research Analyst Nikolaj Lippmann’s base case. But he thinks the tail risk is more material than the market is pricing in. This reminds him of uncertainty experienced ahead of Mexico City's airport being cancelled. Download the Complete Report
Nick Savone, Managing Director
Morgan Stanley | Institutional Equity Division
1585 Broadway, 5th Floor | New York, NY 10036
Phone: +1 212 761-0198
Nick.Savone@morganstanley.com
Be carbon conscious. Please consider our environment before printing this email
Important Information and Qualifications
The information provided herein was prepared by sales, trading, or other non-research personnel of one of the following: Morgan Stanley & Co. LLC, Morgan Stanley & Co. International PLC, Morgan Stanley Europe SE, Morgan Stanley MUFG Securities Co., Ltd, Morgan Stanley Capital Group Inc. and/or Morgan Stanley Asia Limited (together with their affiliates, hereinafter “Morgan Stanley”), but is not a product of the Morgan Stanley Research Department. This communication is a marketing communication and is not a research report, though it may refer to a Morgan Stanley Research report or the views of a Morgan Stanley research analyst. We are not commenting on the fundamentals of any companies mentioned. Unless indicated, all views expressed herein are the views of the author and may differ from or conflict with those of the Morgan Stanley Research or others in the Firm. For additional information and important disclosures, see http://www.morganstanley.com/disclaimers.
Morgan Stanley is not acting as a municipal advisor and the opinions or views contained herein are not intended to be, and do not constitute, advice, including within the meaning of Section 975 of the Dodd- Frank Wall Street Reform and Consumer Protection Act.
This material is not (and should not be construed to be) investment advice (as defined under ERISA or similar concepts under applicable law) from Morgan Stanley with respect to an employee benefit plan or to any person acting as a Fiduciary for an employee benefit plan. This material is not designed to be a recommendation for any specific investment product, strategy, plan feature or other purposes. Any examples used in this material are generic, hypothetical and for illustration purposes only. Communications such as this are not impartial and are provided in connection with the marketing of products and services.
The information provided herein has been prepared solely for informational purposes and is not an offer to buy or sell or a solicitation of an offer to buy or sell the securities or instruments mentioned or to participate in any particular trading strategy. These materials have been based upon information generally available to the public from sources believed to be reliable. No representation is given with respect to their accuracy or completeness, and they may change without notice. Morgan Stanley on its own behalf and on behalf of its affiliates disclaims any and all liability relating to these materials, including, without limitation, any express or implied representations or warranties for statements or errors contained in, or omissions from, these materials. Morgan Stanley and others associated with it may make markets or specialize in, have or may in the future enter into principal positions (long or short) in and effect transactions in securities of companies or trading strategies mentioned or described herein and may also perform or seek to perform investment banking, brokerage or other services for those companies and may enter into transactions with them. We may at any time modify or liquidate all or a portion of such positions and we are under no obligation to contact you to disclose any such intention to modify or liquidate or any such modification or liquidation. Morgan Stanley acts as “prime broker” and lender for a number of hedge funds. As a result, Morgan Stanley may indirectly benefit from increases in investments in hedge funds.
Unless stated otherwise, the material contained herein has not been based on a consideration of any individual client circumstances and as such should not be considered to be a personal recommendation. We remind investors that these investments are subject to market risk and will fluctuate in value. The investments discussed in this communication may be unsuitable for investors depending upon their specific investment objectives and financial position. Where an investment is denominated in a currency other than the investor’s currency, changes in rates of exchange may have an adverse effect on the value, price of, or income derived from the investment. The performance data quoted represents past performance. Past performance is not indicative of future returns. No representation or warranty is made that any returns indicated will be achieved. Certain assumptions may have been made in this analysis, which have resulted in any returns detailed herein. Transaction costs (such as commissions) are not included in the calculation of returns. Changes to the assumptions may have a material impact on any returns detailed. Potential investors should be aware that certain legal, accounting and tax restrictions, margin requirements, commissions and other transaction costs and changes to the assumptions set forth herein may significantly affect the economic consequences of the transactions discussed herein. The information and analyses contained herein are not intended as tax, legal or investment advice and may not be suitable for your specific circumstances. By submitting this communication to you, Morgan Stanley is not advising you to take any particular action based on the information, opinions or views contained herein, and acceptance of such document will be deemed by you acceptance of these conclusions. You should consult with your own municipal, financial, accounting and legal advisors regarding the information, opinions or views contained in this communication.
To receive further information in relation to the past performance of the financial instrument and or underlying (as applicable) and/or the functioning of the financial instrument in different market conditions referred to in any communications produced by employees of any Morgan Stanley entity based in Europe, the Middle East, and Africa (“EMEA”), please contact your EMEA Morgan Stanley Sales representative.
These materials may not be distributed in any jurisdiction where it is unlawful to do so. The products described in this communication may not be marketed or sold or be available for offer or sale in a number of jurisdictions where it is unlawful to do so. This publication is disseminated in Japan by Morgan Stanley MUFG Securities Co., Ltd only to those investors who are “Professional Investors” (tokutei toushika) as defined in the Financial Instrument Exchange Law of Japan and may not be redistributed to other types of investors without the prior written consent of Morgan Stanley (For guidance purposes only. Morgan Stanley MUFG Securities Co., Ltd is a joint venture in Japan between Morgan Stanley and Mitsubishi UFJ Financial Group. Morgan Stanley and Mitsubishi UFJ Financial Group have formed another joint venture in Japan called Mitsubishi UFJ Morgan Stanley Securities Co., Ltd); in Hong Kong by Morgan Stanley Asia Limited; in Singapore by Morgan Stanley Asia (Singapore) Pte. and/or Morgan Stanley Asia (Singapore) Securities Pte. Ltd., each of which is regulated by the Monetary Authority of Singapore and accepts responsibility for its contents of these materials, only to those investors who are institutional investors, accredited investors or expert investors, as defined in the Securities and Futures Act, Chapter 289 of Singapore; in Australia by Morgan Stanley Australia Limited A.B.N. 67 003 734 576, A.F.S.L. No. 233742 and/or Morgan Stanley Australia Securities Limited A.B.N. 55 078 652 276, A.F.S.L. No. 233741, which accept responsibility for its contents; in Canada by Morgan Stanley Canada Limited, which has approved of, and has agreed to take responsibility for, the contents of this publication in Canada; in Spain by Morgan Stanley, S.V., S.A., a Morgan Stanley group company, which is supervised by the Spanish Securities Markets Commission (CNMV) and states that this document has been written and distributed in accordance with the rules of conduct applicable to financial research as established under Spanish regulations; in the United States it is directed only to institutional clients and is distributed by Morgan Stanley & Co. LLC, which accepts responsibility for its contents; and in the United Kingdom it is directed only to those persons who are eligible counterparties or professional clients and must not be acted on or relied upon by retail clients (each as defined in the UK Financial Conduct Authority's rules) and is distributed in the European Union by Morgan Stanley Europe SE, except as provided above. Private U.K. investors should obtain the advice of their Morgan Stanley & Co. International plc representative about the investments concerned. In Australia, this publication, and any access to it, is intended only for “wholesale clients” within the meaning of the Australian Corporations Act. The trademarks and service marks contained herein are the property of their respective owners. Third-party data providers make no warranties or representations of any kind relating to the accuracy, completeness, or timeliness of the data they provide and shall not have liability for any damages of any kind relating to such data.
HYPOTHETICAL PERFORMANCE RESULTS HAVE MANY INHERENT LIMITATIONS, SOME OF WHICH ARE DESCRIBED BELOW. NO REPRESENTATION IS BEING MADE THAT ANY ACCOUNT WILL OR IS LIKELY TO ACHIEVE PROFITS OR LOSSES SIMILAR TO THOSE SHOWN. IN FACT, THERE ARE FREQUENTLY SHARP DIFFERENCES BETWEEN HYPOTHETICAL PERFORMANCE RESULTS AND THE ACTUAL RESULTS SUBSEQUENTLY ACHIEVED BY ANY PARTICULAR TRADING PROGRAM.
ONE OF THE LIMITATIONS OF HYPOTHETICAL PERFORMANCE RESULTS IS THAT THEY ARE GENERALLY PREPARED WITH THE BENEFIT OF HINDSIGHT. IN ADDITION,HYPOTHETICAL
TRADING DOES NOT INVOLVE FINANCIAL RISK, AND NO HYPOTHETICAL TRADING RECORD CAN COMPLETELY ACCOUNT FOR THE IMPACT OF FINANCIAL RISK IN ACTUAL TRADING. FOR EXAMPLE, THE ABILITY TO WITHSTAND LOSSES OR TO ADHERE TO A PARTICULAR TRADING STRATEGY IN SPITE OF TRADING LOSSES ARE MATERIAL POINTS WHICH CAN ALSO ADVERSELY AFFECT ACTUAL TRADING RESULTS. THERE ARE NUMEROUS OTHER FACTORS RELATED TO THE MARKETS IN GENERAL OR TO THE IMPLEMENTATION OF ANY SPECIFIC TRADING PROGRAM WHICH CANNOT BE FULLY ACCOUNTED FOR IN THE PREPARATION OF HYPOTHETICAL PERFORMANCE RESULTS AND ALL OF WHICH CAN ADVERSELY AFFECT ACTUAL TRADING RESULTS.
Any estimates, projections or predictions (including in tabular form) given in this communication are intended to be forward-looking statements. Although Morgan Stanley believes that the expectations in such forward-looking statement are reasonable, it can give no assurance that any forward-looking statements will prove to be correct. Such estimates are subject to actual known and unknown risks, uncertainties and other factors that could cause actual results to differ materially from those projected.
These forward-looking statements speak only as of the date of this communication. Morgan Stanley expressly disclaims any obligation or undertaking to update or revise any forward-looking statement contained herein to reflect any change in its expectations or any change in circumstances upon which such statement is based. Prices indicated are Morgan Stanley offer prices at the close of the date indicated. Actual transactions at these prices may not have been effected.
The trademarks and service marks contained herein are the property of their respective owners.
Additional information on securities discussed herein is available on request. This communication or any portion hereof, may not be reprinted, resold or redistributed without the prior written consent ofMorgan Stanley.
Options are not for everyone. Before engaging in the purchasing or writing of options, investors should understand the nature and extent of their rights and obligations and be aware of the risks involved, including the risks pertaining to the business and financial condition of the issuer and the underlying stock. A secondary market may not exist for these securities. For customers of Morgan Stanley & Co. LLC who are purchasing or writing exchange-traded options, your attention is called to the publication “Characteristics and Risks of Standardized Options”. That publication, which you should have read and understood prior to investing in options, can be viewed on the Web at the following address: http://www.optionsclearing.com/about/publications/character-risks.jsp.
Clients engaging in the execution structure known as Spreading should understand that Spreading may also entail substantial commissions, because it involves at least twice the number of contracts as a long or short position and because spreads are almost invariably closed out prior to expiration. Potential investors should be advised that the tax treatment applicable to spread transactions should be carefully reviewed prior to entering into any transaction. Also, it should be pointed out that while the investor who engages in spread transactions may be reducing risk, he is also reducing his profit potential. The risk/reward ratio, hence, is an important consideration.
The risk of exercise in a spread position is the same as that in a short position. Certain investors may be able to anticipate exercise and execute a "rollover" transaction. However, should exercise occur, it would clearly mark the end of the spread position and thereby change the risk/reward ratio. Due to early assignments of the short side of the spread, what appears to be a limited risk spread may have more risk than initially perceived. An investor with a spread position in index options that is assigned an exercise is at risk for any adverse movement in the current level between the time the settlement value is determined on the date when the exercise notice is filed with OCC and the time when such investor sells or exercises the long leg of the spread. Other multiple-option strategies involving cash settled options, including combinations and straddles, present similar risk.
Copyright © by Morgan Stanley 2019, all rights reserved.
For important information including analyst certification and disclosures regarding specific companies, derivatives, or other instruments discussed in this e-mail, please refer to the latest research report, if attached and/or hyperlinked to this email, or by logging on to Morgan Stanley's Matrix portal at http://www.morganstanley.com/matrix. You may also refer to the Morgan Stanley Research Disclosure Website at http://www.morganstanley.com/eqr/disclosures/webapp/generalresearch.
Morgan Stanley will make certain research products and announcements available only on Morgan Stanley's Matrix platform. For access to Matrix, please contact your sales representative or go to Matrix at http://www.morganstanley.com/matrix.
For access to Research disclosures, please visit: http://www.morganstanley.com/researchdisclosures
For important information including analyst certification and disclosures regarding specific companies, derivatives, or other instruments discussed in this e-mail, please refer to the latest research report, if attached and/or hyperlinked to this email, or by logging on to Morgan Stanley's Matrix portal at http://www.morganstanley.com/matrix. You may also refer to the Morgan Stanley Research Disclosure Website at http://www.morganstanley.com/eqr/disclosures/webapp/generalresearch.
Morgan Stanley will make certain research products and announcements available only on Morgan Stanley's Matrix platform. For access to Matrix, please contact your sales representative or go to Matrix at http://www.morganstanley.com/matrix.
For access to Research disclosures, please visit: http://www.morganstanley.com/researchdisclosures
NOTICE: Morgan Stanley is not acting as a municipal advisor and the opinions or views contained herein are not intended to be, and do not constitute, advice within the meaning of Section 975 of the Dodd-Frank Wall Street Reform and Consumer Protection Act. If you have received this communication in error, please destroy all electronic and paper copies and notify the sender immediately. Mistransmission is not intended to waive confidentiality or privilege. Morgan Stanley reserves the right, to the extent required and/or permitted under applicable law, to monitor electronic communications, including telephone calls with Morgan Stanley personnel. This message is subject to the Morgan Stanley General Disclaimers available at the following link: http://www.morganstanley.com/disclaimers. If you cannot access the links, please notify us by reply message and we will send the contents to you. By communicating with Morgan Stanley you acknowledge that you have read, understand and consent, (where applicable), to the foregoing and the Morgan Stanley General Disclaimers.
You may have certain rights regarding the information that Morgan Stanley collects about you. Please see our Privacy Pledge https://www.morganstanley.com/privacy-pledge