US bond tumult risks triggering stock market volatility, analysts warn
Gap between equities and fixed income volatility measures widens at fastest pace in a decade, according to BofA
Volatility in US bonds is surging in stark contrast to the relatively placid run for equities, leading some analysts to warn over the danger that central banks trigger a spasm of volatility in Wall Street’s stock market.
Fixed income markets have been jolted by fears that rising inflation will force monetary policymakers into scaling back stimulus programmes, but stocks have largely shrugged off these concerns, with Wall Street’s main equities barometers rallying to a series of new record peaks last week.
The gap between measures of the near-term, derivatives-implied volatility of the S&P 500 benchmark and US Treasury bonds has widened at its fastest rate in a decade, according to Bank of America. Some analysts now warn that the divergence indicates investors are complacent about the risks posed by more hawkish central banks.
“Equities — and equity volatility — should not miss the forest for the trees, as they’ve never been more dependent on the Fed and the Fed has never been more dependent on economic data, which itself has never been more volatile,” Riddhi Prasad, a Bank of America analyst, said last week.
The divide in the Vix index of stock volatility and the Move gauge tracking fixed income has been driven by the disparate performance of the two asset classes over the past month. Strong corporate earnings lifted US equities by almost 7 per cent in October in the best month this year, pushing the Vix to a post-coronavirus crisis low of 15.
However, government bonds have been rumbled by signs that quickening inflation will force central banks to tighten monetary policy sooner than Wall Street had previously expected.

Prasad said that the volatility of inflation itself remained at highs last seen in the 1970s, and argued that officials at the US Federal Reserve “have never been more uncertain on their own outlook” on policy. This was “a precarious backdrop for such a self-confident equity market”, Prasad noted.
Christian Mueller-Glissmann, a strategist at Goldman Sachs, also noted the widening schism, and warned clients last week that “the risk of a ‘balanced bear’ — that is, of a combined equity and bond sell-off — lingers as growth decelerates further and inflation remains sticky”.
Technical reasons can explain how stocks can remain relatively subdued in spite of turbulent fixed income markets, such as the unwinding of leveraged hedge fund positions in the latter — which some analysts and investors say has happened in recent days, added Peter Tchir of Academy Securities.
Nonetheless, he also expressed concerns that the stock market was mistakenly oblivious to the volatility that has struck bond markets, and highlighted riskier slices of the corporate debt market as also vulnerable to a setback.
“I just cannot shake the idea that the confluence of events is leading to an ugly day or two of serious ‘risk-off’, which will hit equities and even credit, though high yield and leveraged loans would bear the brunt of that move,” he said.
Jack Caffrey, a portfolio manager at JPMorgan Asset Management, agreed that fixed income markets “do have a finer risk antenna” than equities, and that the recent volatility could presage wider tumult. But he pointed out that equities still enjoyed a supportive backdrop.
“Most companies are pointing to very robust demand environments. The future still seems pretty bright — there are challenges, but they are perceived to be shorter term,” he said. “Right now companies are profitable . . . [and] rising cash returns make it easier to look through rising rates.”
After Hours Summary: ANET +13.8% jumps on earnings and stock split; FN +13.7%, UNVR +9.9%, CAR +5.1%, HLIT +5.1% also up on earnings; IBM to remain in Dow post spin-off; CHGG -27.7%, NBIX -6.8%, VRNS -4.7%, RMBS -3.4% lower on earningsAfter Hours Gainers:
Companies trading higher in after hours in reaction to earnings/guidance: ANET +13.8% (also approves a 4-for-1 stock split), FN +13.7%, UNVR +9.9%, CAR +5.1%, HLIT +5.1%, CLX +4.9%, SPG +4.6%, VNOM +2.9%, ZI +2.8% (also stock offering), MCK +2.6%, GXO +2.5%, SKT +2.1%, BRKR +1.8%, BRX +1.8%, NTR +1.2%, WMB +1.1%, WFRD +1.1%, CRUS +0.9% (also CFO to retire), HOLX +0.6%, O +0.4%, RRX +0.2%, OGS +0.1%, PSA +0.1% (also acquires All Storage portfolio for $1.5 bln; also names new COO)
Companies trading higher in after hours in reaction to news: BCOV +7.9% (activist shareholder writes letter to co), FCX +2.3% (approves new $3 bln share repurchase program; also approves addition of a variable dividend), CNTX +2% (names new CFO), OLN +1.9% (approves new $1.0 bln share repurchase program), ALEX +1.7% (names new COO), SHLX +1.3% (common unit offering), EVLV +1.2% (names new CFO), MVST +1.2% (purchases new R&D center in Florida), NVTS +1% (NVTS and Xiaomi highlight alignment on future GaN applications), INVZ +0.8% (issues statement in light of recent trading activity), GNRC +0.8% (to acquire ecobee, which makes smart thermostats), ELY +0.6% (announces minority investment in Five Iron Golf), LTHM +0.5% (introduces proprietary LIOVIX lithium metal product), FUBO +0.4% (fuboTV and dentsu capture live sports fans on CTV by leveraging M1 data platform), AADI +0.4% (names new CFO), SSYS +0.3% (announces partnership with Ricoh USA to provide anatomic modeling services to healthcare facilities), LMT +0.3% (awarded $250 mln US Special Operations Command contract), VMW +0.2% (DELL completes planned spin-off of 81% equity ownership of VMW), EAF +0.1% (CFO retires), OEC +0.1% (to increase specialty carbon black prices), KAMN +0.1% (receives award to provide components to leading eVTOL company), GOOG +0.1% (starts negotiations with news publishers to license content in Europe)
After Hours Losers:
Companies trading lower in after hours in reaction to earnings/guidance: CHGG -27.7%, SMLR -23.9%, BWXT -9%, NBIX -6.8%, LXU -6.5%, PNTG -5%, PLOW -4.7%, VRNS -4.7%, RIG -4.5%, LEG -3.4%, RMBS -3.4%, EVER -3.1%, MOS -1.9%, CACC -1.7%, FANG -1.2%, BCC -0.8%, NXPI -0.8%, AMRC -0.8%, MGY -0.7%, CVI -0.6%, SBAC -0.4%, BSM -0.2%
Companies trading lower in after hours in reaction to news: LEGN -9.8% (FDA extends PDUFA target date for ciltacabtagene autoleucel to Feb 28, 2022), IVC -7.4% (to be removed from S&P SmallCap 600), ABR -3.8% (stock offering), PI -3.1% (convertible notes offering), VRT -2.6% (stock offering), ACAD -1.6% (names new COO), NEP -1.3% (stock offering), IGT -0.6% (signs licensing deal with Authentic Brands, owner of Marilyn Monroe Estate), CRWD -0.2% (to acquire SecureCircle), AMZN -0.2% (TikTok TV app on Fire TV is now available), IBP -0.1% (acquires Denison Glass and Mirror), NP -0.1% (increases dividend), IBM -0.1% (to remain in Dow Jones Industrial Average after Kyndryl spin-off)
Rivian Automotive Targets IPO Valuation Just Above $60 Billion
Amazon-backed electric-vehicle startup plans for IPO next week on Nasdaq
Rivian Automotive Inc. is seeking a valuation in the low-$60s-billion range in its initial public offering next week, one of the biggest and most-anticipated deals yet in a blockbuster year for new issues.
The Amazon.com Inc. -backed electric-vehicle startup plans to disclose the targeted valuation in an updated regulatory filing later Monday, according to people familiar with the matter. The roadshow for company management and their underwriters to pitch the shares to potential investors begins Tuesday, and the shares are to start trading on the Nasdaq Stock Market next week under the symbol RIVN.
The valuation could shift by then based on investor feedback and market conditions.
Biden Administration Targets Stablecoin Digital Currency for Banklike Oversight
A Treasury-led panel asked Congress to set up a regulatory framework to address growing risks
WASHINGTON—The Biden administration on Monday took the first significant step to impose banklike oversight on the cryptocurrency companies involved in the issuance of stablecoins, outlining a process that could shape the future of that digital money.
A Treasury-led panel recommended that Congress impose a new regulatory framework around stablecoins—digital currencies pegged to national currencies like the U.S. dollar—and limit the issuance of such digital assets to banks. The legislative request is a tall order given both chambers of Congress are narrowly divided.
In the absence of congressional action, the panel recommended that a broader group of regulators charged with detecting risks to the financial system—the Financial Stability Oversight Council—consider whether to designate certain stablecoin activities as systemically important. Such a process could ultimately lead to the Federal Reserve writing more-stringent risk-management standards for stablecoin companies.
“The rapid growth of stablecoins increases the urgency of this work,” the regulators said in Monday’s report, issued by the President’s Working Group on Financial Markets, which includes the heads of several regulatory agencies. “Failure to act risks growth of payment stablecoins without adequate protection for users, the financial system and the broader economy.”
Stablecoins are issued by companies such as Tether Ltd. and Circle Internet Financial Inc. and are designed to combine the ability to trade quickly online like bitcoin with the stability of national currencies like the dollar. But the Treasury-led panel said stablecoins could fuel instability if users come to doubt the value of their underlying assets that keep their prices stable, among other risks.
Stablecoins are used mainly by investors to buy and sell crypto assets on exchanges such as Coinbase, which process trades 24 hours a day. They are also used as collateral for derivatives—contracts to buy or sell an underlying security at a specified price.
That could quickly change over the coming years. Administration officials say the coins may be used more broadly as a swift means of payment for consumers and businesses, putting them into competition with banks and card networks such as Visa Inc. and Mastercard Inc. Diem Association, a group backed by Meta Platforms Inc., formerly Facebook Inc., and 25 other members, is seeking to launch a stablecoin that will leverage the social network’s three billion users. Diem is partnering with a bank regulated by the Fed on the project.
The transition to broader use of stablecoins “could occur rapidly due to network effects or relationships between stablecoins and existing user bases or platforms,” Monday’s report said.
The administration said it would prefer if Congress were to create a regulatory framework for stablecoin issuers, but signaled it is prepared to move forward through FSOC if Congress doesn’t act.
The regulatory route has drawbacks, officials have said. The FSOC process for targeting firms for stricter regulation is historically cumbersome and would have to be applied in a novel manner in this case—to cover stablecoin-related payment activities, instead of targeting a specific set of nonbank financial firms. It could also face legal challenges.
“Legislation could be helpful, but the downside of course is how long that will take to get,” said Timothy Massad, who was a member of the working group when he led the Commodity Futures Trading Commission during the Obama administration. “That’s why FSOC is another way to go that provides a means to create a pretty comprehensive framework.”
At present, many stablecoins are lightly overseen at the state level, though some companies, such as Circle, have said they are seeking to become banks and welcome the development of clear standards.
Stablecoins are a relatively small but fast-growing corner of the $2 trillion crypto world. The value of the three largest—Tether, Circle’s USD Coin and Binance USD—has grown to about $116 billion from about $11 billion a year ago.
Jeremy Allaire, chief executive and co-founder of Circle, praised Monday’s report. “This is huge progress in the acceptance of stablecoins and provides a path for their adoption as fundamental infrastructure for financial and economic activity in the coming decade,” he said.
Representatives of Tether and Binance didn’t respond to requests for comment Monday afternoon.
Because stablecoins are backed by assets such as Treasurys, they should maintain a tight link to the dollar and easily be redeemed for dollars, the issuers say. This contrasts with cryptocurrencies like bitcoin that aren’t backed by assets and can fluctuate wildly in value.
Current and former regulators worry that stablecoins could be vulnerable to the equivalent of a bank run if large numbers of investors suddenly rush to redeem them, forcing sponsors to sell the assets at fire-sale prices and potentially putting stress on capital markets, as well.
“Fire sales of reserve assets could disrupt critical funding markets,” Monday’s report said. “Runs could spread contagiously from one stablecoin to another, or to other types of financial institutions.”
Closing Stock Market SummaryThe S&P 500 (+0.2%), Nasdaq Composite (+0.6%), and Dow Jones Industrial Average (+0.3%) rose modestly on Monday and each set intraday and closing record highs. The small-cap Russell 2000 (+2.7%) and iShares Micro-Cap ETF (IWC 151.65, +4.11, +2.8%) played catch-up with gains over 2.5%.
The muted price action in the S&P 500 was largely due to weakness in Apple (AAPL 148.96, -0.84, -0.6%), Microsoft (MSFT 329.37, -2.25, -0.7%), Amazon.com (AMZN 3318.11, -54.32, -1.6%), and Alphabet (GOOG 2875.48, -89.93, -3.0%), which account for approximately 20.5% of the S&P 500's market capitalization.
The broader market looked better, not only evident from the big gains in small-caps and micro-caps, but also the 0.8% gain in the Invesco S&P 500 Equal Weight ETF (RSP 159.02, +1.26, +0.8%). Eight of the 11 S&P 500 sectors closed higher as new money got put to work on the first day of the month.
The consumer discretionary (+1.5%) and energy (+1.6%) sectors outperformed amid an 8.5% gain in Tesla (TSLA 1208.92, +94.92, +8.5%) on no specific news and higher oil prices ($84.05/bbl, +0.52, +0.6%). The communication services, (-0.7%), information technology (-0.1%), and health care (-0.1%) sectors closed lower.
Semiconductor stocks mitigated the decline in the tech sector following On Semiconductor's (ON 54.96, +6.89, +14.3%) better-than-expected earnings report. The Philadelphia Semiconductor Index rose 1.6%.
In Washington, Congressional Progressive Caucus leader Jayapal (D-WA) said progressives will support both infrastructure bills with the addition of several other items, but Senator Manchin (D-WV) said he won't support the budget reconciliation bill without further clarity on its economic impacts.
Treasury Secretary Yellen hinted at the possibility of removing some China tariffs, and the U.S. and EU agreed to ease tariffs on steel and aluminum imports. Harley-Davidson (HOG 39.80, +3.31, +9.1%) was a beneficiary of the U.S.-EU agreement.
Separately, there wasn't a noticeable reaction to the October ISM Manufacturing Index, which decelerated modestly to 60.8% (consensus 60.5%) from 61.1% in September. The report continued to depict robust demand along with ongoing struggles to meet that demand due to supply chain issues.
The 2-yr yield increased two basis points to 0.51%, and the 10-yr yield increased two basis points to 1.58%. The U.S. Dollar Index fell 0.3% to 93.86.
Reviewing Monday's economic data:
- The October ISM Manufacturing Index checked in at 60.8% (consensus 60.5%), down from 61.1% in September. A number above 50.0% is indicative of expansion. October marked the 17th straight month of expansion for the manufacturing sector.
- The key takeaway from the report is still the same. Demand is strong, but manufacturers and suppliers continue to struggle to meet increasing demand levels due to a range of factors that includes record-long raw material lead times, shortages of basic materials, transportation difficulties, worker absenteeism, and difficulty filling positions.
- Total construction spending declined 0.5% month-over-month in September ( consensus +0.5%) following an upwardly revised 0.1% increase (from 0.0%) in August. Total private construction declined 0.5% month-over-month while total public construction spending decreased 0.7%.
- The key takeaway from the report is the continued decline seen in new single family and multifamily construction. That is most likely the consequence of ongoing supply chain pressures and higher costs for builders that are standing in the way of building more affordable homes.
- The final IHS Market Manufacturing PMI for September checked in at 58.4, down from 60.7 in the preliminary reading.
There are is no economic data of note scheduled for Tuesday.
- S&P 500 +22.8% YTD
- Nasdaq Composite +21.0% YTD
- Russell 2000 +19.4% YTD
- Dow Jones Industrial Average +17.3% YTD
Early premarket gappers
Gapping up:
ANIP +14.5%, NVAX +9.7%, MIGI +7.9%, XPEV +2.8%, TEVA +2.5%, LMPX +2.3%, JOBY +2.1%, BNTX +1.3%, NUE +1.2%, FB +1.1%, SCM +1%, MX +0.7%, PFE +0.7%
Gapping down:
BTBT -14.4%, JELD -5%, NIO -4%, OIS -4%, MARK -3.8%, WRAP -2.5%, REKR -2.2%, LI -2.2%, MRNA -2.2%, BCS -1.7%
Amsterdam Real Housing Prices Highest In 400 Years: An Analysis Of A Bubble

By Jan Nieuwenhuijs of The Gold Observer
Housing prices in Amsterdam, corrected for inflation, have never been this high in recorded history. Next to low interest rates, the cause of rapidly rising prices is a feedback cycle between banks and consumers having become addicted to mortgage lending and ever-increasing prices.

With the Great Financial Crisis—caused by a real estate bubble—still fresh in our memories, in many advanced economies housing prices are currently rising at a record pace. In the Netherlands housing prices were up 19% in the third quarter of 2021, compared to the year before.
Some economists perceive housing prices in Amsterdam—of which I have obtained the longest-running index—to be overvalued since 2020, based on a model of rent prices and interest rates. Others point towards policies implemented in the West over many decades that have created a “housing-finance feedback cycle,” wherein banks have become addicted to mortgage lending, fueling housing prices, and consumption increasingly relies on the “wealth” generated by rising prices. Because this trend makes banks lend less credit to productive businesses, the very core of economies is weakened.
The Longest-Running Real Estate Index
Several building blocks of capitalism have been invented in Amsterdam, the capital of the Netherlands (Holland). In the late 16th century, the Dutch embarked on trading expeditions over sea to Asia. By 1600 there were six fledgling “East India” companies sailing from Dutch ports. To combat Spanish and Portuguese competition, and not compete against each other, the six existing companies merged into one: the United East India Company (De Verenigde Oost-Indische Compagnie, or VOC for short). The VOC was formally chartered in 1602, and became the first joint-stock company, with its shares changing hands on the first stock exchange. Money from all over Europe poured into the Netherlands. Because of the VOC’s extraordinary success Amsterdam needed to expand, and did so by digging three canals around the medieval city center: the Herengracht, Keizersgracht, and Prinsengracht.
Transaction prices of real estate on the Herengracht, the finest of them all, have been carefully recorded. In 1997 Dutch economist Piet Eichholtz build a price index of houses on the Herengracht with a constant quality from 1628 until 1973. This was the birth of the Herengracht Index. Eichholtz’s initial research showed that real housing prices (corrected for consumer price inflation) gradually changed over time, but were fairly equal in 1973 compared to prices in 1628.
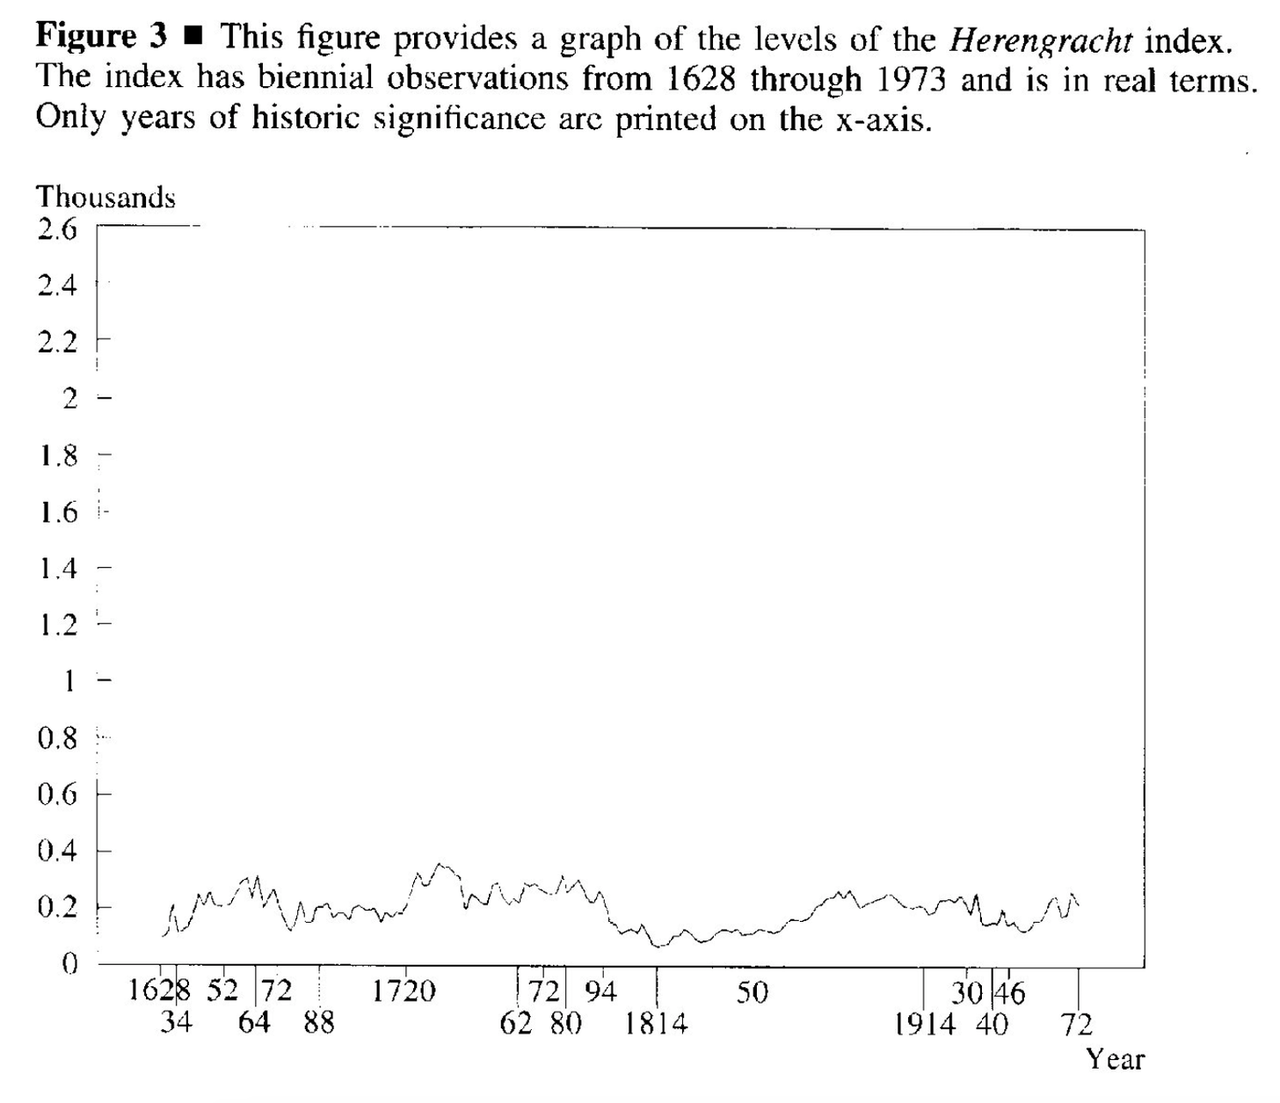
Eichholtz et al published an update on historic housing prices in Amsterdam in 2020. For this publication Eichholtz et al collected a deeper set of data, which starts in 1620 and includes houses from a wider area. Although the numbers show prices started to rise significantly from the 1990s onwards, their conclusion was that the housing market was not in a bubble, based on rent prices and interest rates.
One of Eichholtz’s colleagues, Mathijs Korevaar, was so kind to provide me their data up till September 2021. In an email he wrote me that after 2019 prices have risen to such an extent that their model suggests real estate in Amsterdam is now overvalued. Below is the chart of Amsterdam real housing prices from 1620 through September 2021.
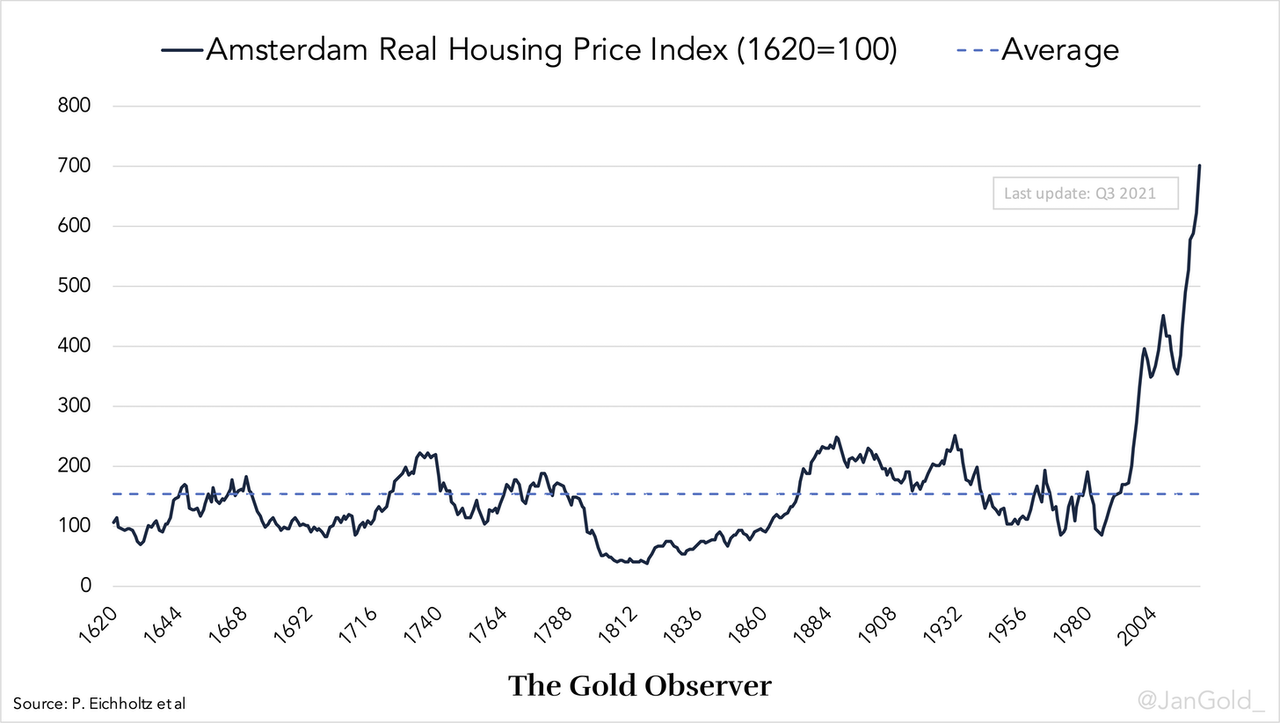
What happened in the 1990s that pushed housing prices far above prices during Holland’s Golden Age in the 17th century and second Golden Age in the late 19th century? To obtain a broader understanding of the housing market—beyond a model based on rent prices and interest rates—I read the work of an economist specialized in land, housing and banking: Josh Ryan-Collins.
The Mortgage Revolution
According to Ryan-Collins there have been two major developments in the housing market since the tun of the 19th century: a change in land tax and financial deregulation. Although he mostly researched Anglo-Saxon economies, I cross-checked his findings in the Netherlands.
Classic economists, such Adam Smith and John Stuart Mill, viewed land an asset incomparable to other assets, mainly because it’s in fixed supply and immobile. If demand for land increases, the price rises without triggering more supply. As a consequence, if there is economic growth, the value of land—on which houses are build—rises disproportional to goods and services (even if the owner of the land plays no role in the creation of that value). The solution of Smith and Mill was to tax land, more so than labour or profits. Indeed, in the 18th and 19th century land tax was a major source of income in the U.S. and Europe.
Then came the neoclassical economists that did away with the aforementioned theories on land. In the 20th century a shift emerged from land tax to income tax. It became increasingly more attractive to own a house as a financial asset. All that was missing was a way to finance real estate.
From the 1930s through 1970s the governments in most advanced economies imposed “credit guidance” on banks, which restricted mortgage lending. By preference banks lend mortgage credit over corporate credit, because the former is less risky. Commonly, the house bought with a mortgage serves as secure collateral for the loan. In case the borrower goes bankrupt, the bank can obtain the collateral and the damage is confined. In case of lending to a business, there can be no collateral or collateral of low quality. For society, though, lending to productive businesses is essential, as it creates sustainable economic growth and incomes to service debt. But credit guidance has slowly been dismantled, and as a result banks’ mortgage credit overtook non-mortgage credit in 1995. The mortgage revolution was a fact.
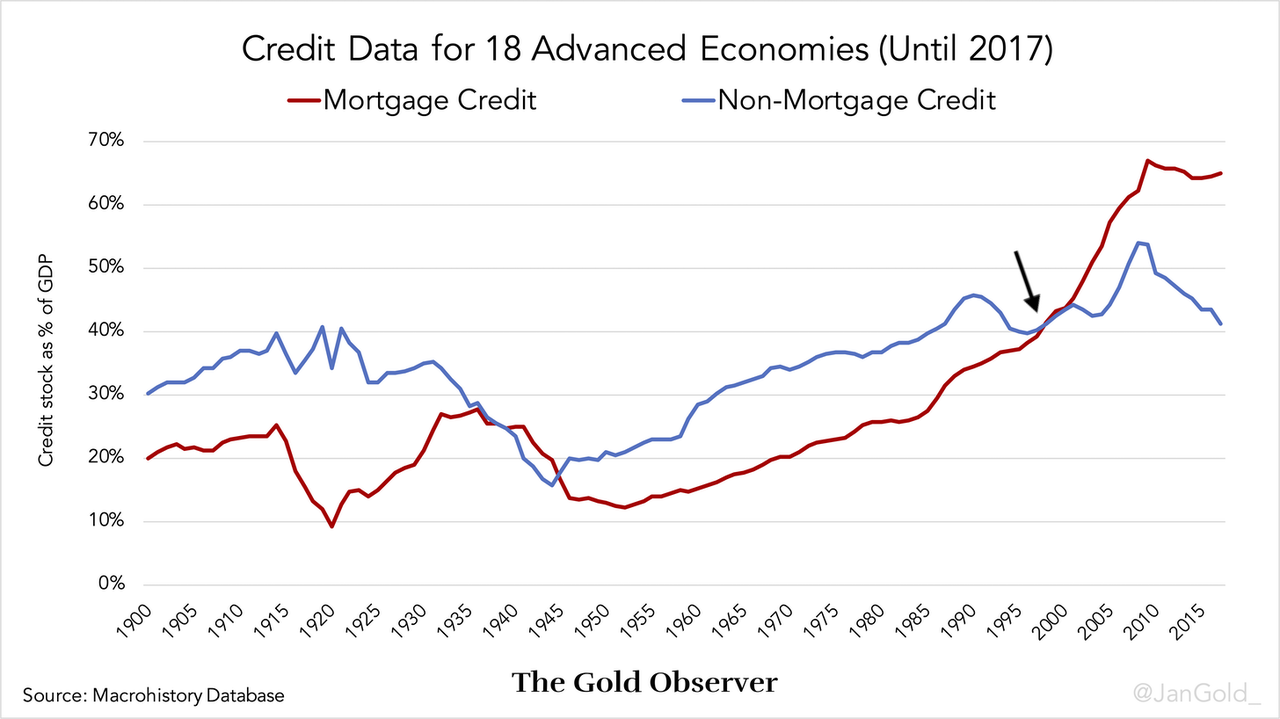
A bank creates money out of thin air when it lends credit. So, in case banks are lending mortgage credit the money supply is expanded, but the money is spend on a limited quantity of houses. The money supply is elastic, while the supply of houses is inelastic. No wonder that in the 1990s housing prices went up. Subsequently, the housing-finance feedback cycle was triggered: higher housing prices created more demand for mortgages, which further pumped up prices, resulting in more demand for mortgages, and so on.
The securitization of mortgages, that took off in the 1990s, also contributed to “the cycle.” Securitization enables banks to bundle and package mortgages into a Mortgage Backed Security (MBS). An illiquid asset (mortgage) is turned into a liquid asset (MBS) that can be sold, for example, to a pension fund. Banks earn fees for selling MBSs, and when the securities are off their balance sheet, it leaves more room for new mortgage lending.
Last but not least, the capital controls that were lifted after the breakdown of Bretton Woods in 1971, meant that banks were no longer dependent on domestic deposits for their funding. Banks gained access to international money markets, where they could attract additional funding for housing credit.
Escalating property prices result in a higher house price-to-income ratio and thus less consumer spending. This loss in spending in the housing-finance feedback economy is compensated by the “wealth” generated from increased housing prices. People that have unrealized gains on their property will, i.e., spend more because they feel wealthier (wealth effect), or take out a second mortgage to buy a boat (equity withdraw). Other people’s profits increase through speculating on real estate. But consumption can only keep up for as long as the cycle is perpetuated.
Conclusion
The cycle needs more debt and increasing housing prices. This unsustainable debt spiral endures by the grace of central banks lowering interest rates. In my view, the above resembles a ponzi scheme and the housing market is in a bubble. Although I am not certain how long this situation will last and how the bubble will pop. Perhaps nominal housing prices will decline, perhaps inflation will rise such that real housing prices retrace their long-term average. A problem with declining nominal prices is that it can tear down the banking system, something central banks want to prevent, as banks have massive exposure to mortgages.
I would like to stress that not every (advanced) economy has the same housing market. Neither do mortgage debt levels rise in a linear fashion. After the Great Financial Crisis in 2008 housing prices and mortgage debt levels fell in many economies. In response to the crisis governments came to the rescue to bail out banks and support the economy—which increased government debt. The housing bubble was not allowed to fully deflate. Interest rates hit zero, real interest rates went negative, and the cycle was re-activated. Housing prices resumed their ascent.
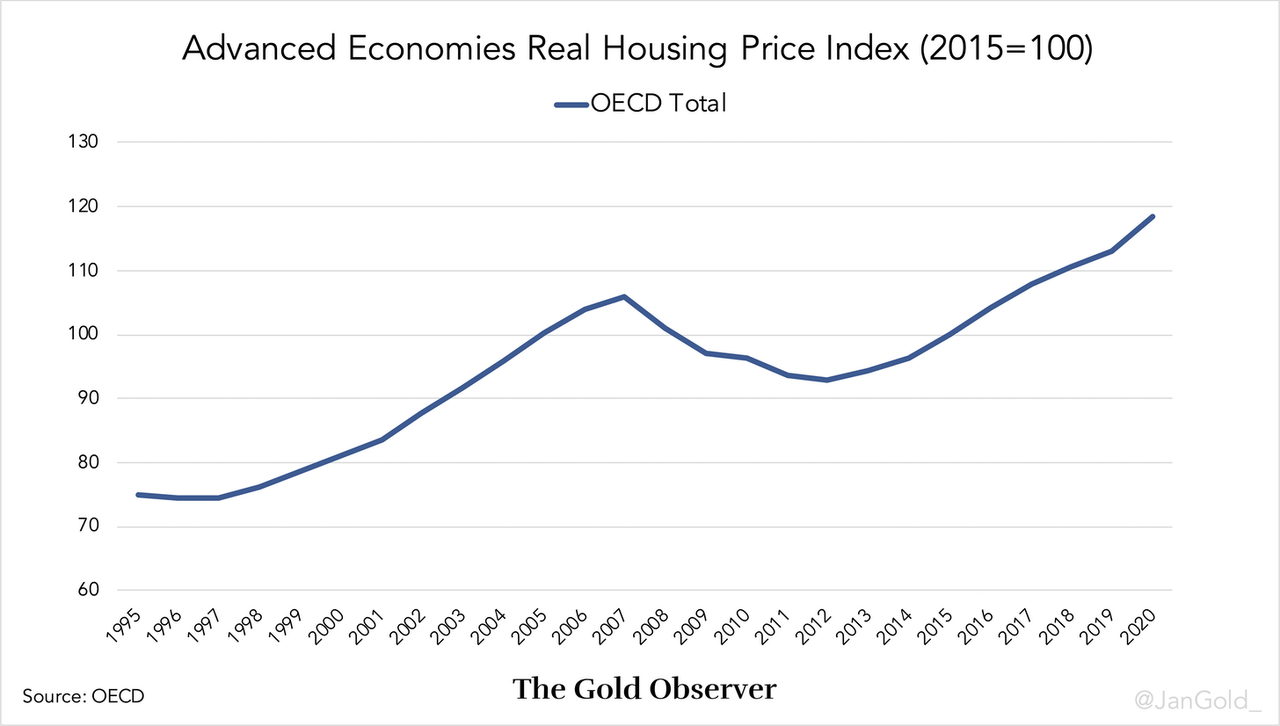
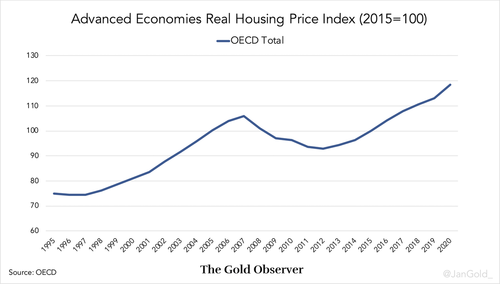
OECD countries include most advanced economies
Furthermore, an academic paper (“More Mortgages, Lower Growth?”) from 2016 by Dirk Bezemer et al states:
In newly collected data on 46 economies over 1990-2011, we show that financial development since 1990 was mostly due to growth in credit to real estate and other asset markets, which has a negative growth coefficient. … We find positive growth effects for credit flows to nonfinancial business but not for mortgage and other asset market credit flows. …
Not only did the mortgage revolution “crowd out” credit for productive businesses, the credit flow to mortgages has a negative growth effect.
Can it be that the mortgage revolution, which has stifled growth, combined with a fiat international monetary system that enables unlimited debt levels, has spawned the greatest debt trap in the history of the world?
Finally, in the Netherlands, and I suppose elsewhere, the most mentioned solution for unaffordable housing is to simply build more houses. This approach fails, because banks can always print money faster than anyone can build houses. The solution is to be found on the demand side, not the supply side.
All sources can be found here.