- Reports Q4 (Dec) GAAP loss of $0.49 per share, $0.05 worse than the S&P Capital IQ estimate of ($0.44); revenues rose 14.2% year/year to $362.7 mln vs the $366.64 mln S&P Capital IQ Consensus.
- Options for the quarter increased 14% yr/yr to $163 million; Cryptocurrencies for the quarter increased 304% yr/yr to $48 million; Equities for the quarter decreased 35% to $52 million.
- Monthly Active Users (MAU) increased 48% to 17.3 million for December 2021, compared with 11.7 million for December 2020. On a sequential basis, MAU decreased 8% compared with 18.9 million for September 2021.
- Average Revenues Per User (ARPU) for the quarter decreased 39% to $64 on an annualized basis, compared with $106 in the fourth quarter of 2020.
- HOOD issues downsideguidance , expects 1Q22 revenue will be less than $340 mln vs. the $438.7 mln S&P Capital IQ consensus estimate. which assumes some incremental improvement in trading volumes versus what we have seen so far. At the top end, this implies a year-over-year revenue decline of 35% compared to the first quarter of 2021, during which we saw outsized revenue performance due to heightened trading activity, particularly relating to certain meme-stocks.
- For fiscal year 2022, Robinhood expects total operating expenses, excluding share-based compensation, to increase 15-20% year-over-year. Additionally, HOOD expects share-based compensation to decline 35-40% year-over-year.
- Reports Q4 (Dec) net income of $1.51 per share, $0.08 better than the S&P Capital IQ Consensus of $1.43; service revenues rose 35.7% year/year to $1.77 bln vs the $1.71 bln S&P Capital IQ Consensus.
- Reports Q4 (Dec) earnings of $0.56 per share, excluding non-recurring items, $0.03 better than the S&P Capital IQ Consensus of $0.53; revenues rose 6.3% year/year to $1.3 bln vs the $1.27 bln S&P Capital IQ Consensus.
- "We experienced better than expected demand during the December quarter, with strong double-digit order growth across all verticals, all customer solutions and all geographies," said Juniper's CEO, Rami Rahim.
- Co issues in-line guidance for Q1, sees EPS of ~$0.31, plus or minus $0.05, excluding non-recurring items, which translates to ~$0.26-0.36 vs. $0.31 S&P Capital IQ Consensus; sees Q1 revs of ~$1.15 bln, plus or minus $50 mln, which translates to ~$1.100-1.200 bln vs. $1.13 bln S&P Capital IQ Consensus.
- Non-GAAP gross margin will be approximately 58.0%, plus or minus 1%.
- Non-GAAP operating margin will be approximately 11.8% at the mid-point of revenue guidance.
- Juniper today announced a 5% increase in its quarterly cash dividend to $0.21 per share, to be paid on March 22, 2022 to stockholders of record as of the close of business on March 1, 2022.
- Reports Q4 (Dec) earnings of $3.64 per share, excluding non-recurring items, $0.61 worse than the S&P Capital IQ Consensus of $4.25; revenues rose 119.4% year/year to $5.62 bln vs the $5.35 bln S&P Capital IQ Consensus.
- Q4 adjusted EBITDA jumped to $1.728 bln vs $87 mln a year ago.
- "We enter 2022 from a position of strength and are relentlessly focused on continuing our disciplined approach to creating stockholder value. Our balance sheet has been transformed, record cash significantly de-risks strategy execution, and our capital allocation priorities have enhanced direct stockholder returns. We are a fundamentally different company from a year ago and expect 2022 to be another strong year."
- Co also authorizes a new $500 mln stock repurchase program to commence in Q1. This is in addition to a previously announced $300 mln authorization.
- Reports Q4 (Dec) earnings of $4.91 per share, excluding non-recurring items, $0.15 worse than the S&P Capital IQ Consensus of $5.06; revenues rose 43.0% year/year to $2.27 bln vs the $2.26 bln S&P Capital IQ Consensus.
- Co issues upside guidance for Q1, sees EPS of $4.30 to $4.60, excluding non-recurring items, vs. $4.28 S&P Capital IQ Consensus.
- Co issues downside guidance for FY22, sees EPS of at least $15.00, excluding non-recurring items, vs. $15.92 S&P Capital IQ Consensus.
- Reports Q4 (Dec) earnings of $1.81 per share, excluding non-recurring items, $0.06 worse than the S&P Capital IQ Consensus of $1.87; revenues rose 23.2% year/year to $2.69 bln vs the $2.38 bln S&P Capital IQ Consensus.
- Co issues in-line EPS guidance for FY22, sees EPS of $9.50-$10.00 vs. $9.72 S&P Capital IQ Consensus. Expects FY22 revenue to be higher than FY21 revenue of $10.48 bln compared to the $9.8 bln S&P Capital IQ consensus estimate.
- Reports Q1 (Dec) earnings of $2.10 per share, $0.21 better than the S&P Capital IQ Consensus of $1.89; revenues rose 11.3% year/year to $123.94 bln vs the $118.53 bln S&P Capital IQ Consensus.
- Q1 iPhone revenue $71.6 bln vs. $67.5 bln ests
- Q1 Mac revenue $10.8 bln vs. $9.5 bln ests
- Q1 iPad revenue $7.25 bln vs. $7.8 bln ests.
- Q1 wearables revenue $14.7 bln vs. $14.0 bln ests.
- Q1 services revenue $19.5 bln vs. $19.7 bln ests.
- Q1 gross margin was 43.7% versus 41.6% ests.
Closing Stock Market SummaryThe S&P 500 lost 0.5% on Thursday, closing lower for the third straight day as investors sold into early strength amid lingering concerns about a hawkish Fed. The Nasdaq Composite (-1.4%) and Russell 2000 (-2.3%) posted steeper declines while the Dow Jones Industrial Average (-0.02%) closed fractionally lower.
Each of the major indices started the session with gains over 1.5% in another rebound-minded pursuit. There wasn't any specific news that triggered the positive bias, and likewise, there wasn't a catalyst to account for the intraday turnaround, although it's likely that the Fed remained a primary concern along with disappointing earnings reactions and stubborn technical factors.
The fed funds futures market started to price in the probability for five rate hikes this year following the FOMC meeting yesterday, and the Treasury market behaved accordingly as the 2-yr yield jumped 11 basis points to 1.19%. The 10-yr yield declined four basis points to 1.81% as investors sniffed the potential for the Fed to upset growth prospects with its tightening plans.
Despite the negative index closes, six of the 11 S&P 500 sectors still closed in positive territory, including energy (+1.2%), utilities (+0.8%), and consumer staples (+0.6%). The consumer discretionary (-2.3%), information technology (-0.7%), and financials (-0.9%) sectors were the influential laggards.
The curve-flattening activity in the Treasury market was a headwind for the bank stocks, but as noted, the consumer discretionary sector was the weakest performer, primarily due to a 10% decline in Tesla (TSLA 829.10, -108.31, -11.6%), which delayed new vehicle launches amid persistent supply chain issues.
The Philadelphia Semiconductor Index (-4.8%) was another weak spot, falling 5% after Intel (INTC 48.05, -3.64, -7.0%), Lam Research (LRCX 555.30, -41.37, -6.9%), and Teradyne (TER 111.24, -32.13, -22.4%) each provided disappointing quarterly guidance.
McDonald's (MCD 248.74, -1.11, -0.4%), Dow Inc. (DOW 60.18, +2.96, +5.2%), MasterCard (MA 350.53, +5.87, +1.7%), and Comcast (CMCSA 48.01, -0.45, -0.9%) were other high-profile companies that reported earnings. Apple (AAPL 159.22, -0.47, -0.3%) closed lower in front of its earnings report after the close.
Other factors in the mix included the S&P 500 finding technical resistance at its 200-day moving average (4434), which might have fueled the downside volatility in the broader market, and the Advance Q4 GDP report, which showed decent growth in the economy and inflation.
Separately, the U.S. Dollar Index rose 1.4% to 97.25 amid a view that rate hikes will drive greater demand for the dollar in an environment where foreign central banks are hesitant to rein in policy support. Crude futures ($86.62, -0.74, -0.9%) and precious metals were clipped by the stronger dollar.
Reviewing Thursday's economic data:
- The Advance Q4 GDP report showed real GDP increasing at an annual rate of 6.9% (Briefing.com consensus 5.6%) following a 2.3% increase in the third quarter. The GDP Chain Deflator was also up 6.9% ( consensus 5.9%) after a 6.0% increase in the third quarter.
- The key takeaway from the report is the recognition that services spending drove the 3.3% increase in personal spending and that inventory investment was the biggest contributor to the increase in real GDP. Real final sales of domestic product, which exclude the change in inventories, were up 1.9%.
- Initial jobless claims for the week ending January 22 decreased by 30,000 to 260,000 ( consensus 260,000). Continuing claims for the week ending January 15 increased by 51,000 to 1.675 million.
- The key takeaway from the report is that initial claims came down from the prior week, but are still somewhat elevated presumably due to the effects of the Omicron variant.
- December Durable Goods Orders decreased 0.9% month-over-month (consensus -0.5%) while orders, excluding transportation, increased 0.4% ( consensus 0.4%).
- The key takeaway from the report is the slowdown in business spending, evidenced by an unchanged reading for nondefense capital goods orders excluding aircraft that followed on the heels of a 0.3% increase in November.
Looking ahead, investors will receive Personal Income and Spending for December, PCE Prices for December, the final University of Michigan Index of Consumer Sentiment for January, and the Q4 Employment Cost Index on Friday.
- Dow Jones Industrial Average -6.0% YTD
- S&P 500 -9.2% YTD
- Russell 2000 -14.0% YTD
- Nasdaq Composite -14.7% YTD
-
HF Flows – dip buying on Mon and Tues, post large selling on Fri:
- HFs bought the dip on Mon and Tues (just under +1z globally both days)
- Notionally, the biggest buying was in N. America (+1.4z on Mon and 1.2z on Tues). N. America buying on Tues was evenly split between longs added and short covered. L/S funds were net buyers on both days, although the majority of buying on Mon was short covering, while ~75% of buying yest came from longs added.
-
EMEA also saw meaningful buying on Tues (+1.8z) following a week of neutral activity and most of the buying was due to longs added.
- In contrast, APAC saw selling increase on Tues (-2z) as flows reverse. Notably APAC had seen the largest acceleration in buying in late Dec and early Jan, but has seen flows turn much more negative as the broad indices have hit new lows (rather than just going back to early Oct levels like in NA or EMEA). The selling on Tues was mostly longs sold
-
ETF Flows – turning more positive:
- Second day in a row of buying yest at about +2.8bn (vs. +1.4bn), after 7 days of net selling
- Note: these flows are based on a selection of broad index ETFs (e.g. SPY, IWM, QQQ) as well as sector ETFs (e.g. XLF, XLE)
-
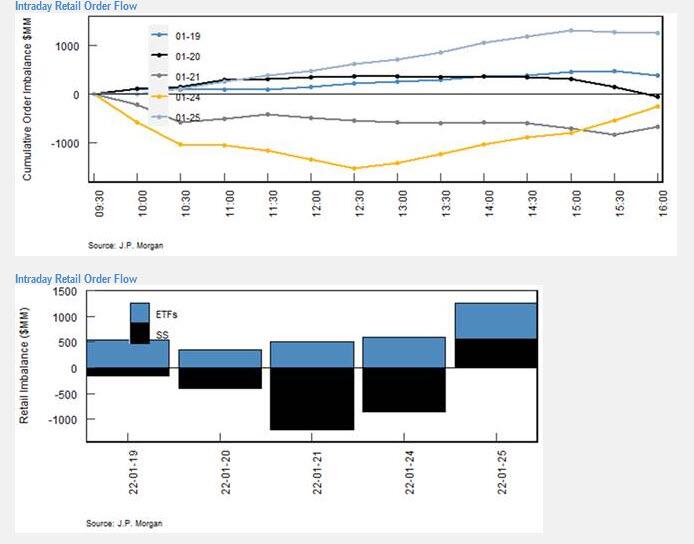
Retail Flows – reversal to buying (based on data from Peng Cheng, JPM QDS Research):
- Overall flows turned to >1Bn of net buying on Tues
- Notably, single-stocks saw net buying return (almost ~$500mm bought) vs. the selling of the prior 4 days
- Through Monday, single-stocks had been net sold for 4 days in a row. The 5d rolling net flows for single-stocks is at one of the most negative of the past 2 years...it only got a lot more negative in March 2020. Including ETFs, however, the 5d flows are still positive and the 20d are still very positive
- Reports Q2 (Dec) earnings of $2.30 per share, excluding non-recurring items, $0.18 better than the S&P Capital IQ Consensus of $2.12; revenues rose 22.6% year/year to $4.83 bln vs the $4.82 bln S&P Capital IQ Consensus.
- Co issues downside guidance for Q3 (Mar), sees EPS of $1.50-1.80, excluding non-recurring items, vs. $1.93 S&P Capital IQ Consensus; sees Q3 revs of $4.45-4.65 bln vs. $4.73 bln S&P Capital IQ Consensus.
- "While we continue to experience strong demand across our end markets, these challenges continue to present a headwind to near-term results. We've executed well in building a solid foundation for future profitable growth driven by innovative products within our flash and hard drive businesses. As these transitory headwinds subside, we expect to emerge in a stronger position..."