After Hours Summary: SCSC +4.6%, INTU +2% higher on earnings; JWN -7.9%, URBN -3.4% lower on earnings; several index changes announced, TECH +0.1% to join S&P 500; HUGE -13.4% falls on plan to terminate Phase 2 trialAfter Hours Gainers:
Companies trading higher in after hours in reaction to earnings/guidance: SCSC +4.6% (also announces new $100 mln share repurchase auth), INTU +2% (also increases dividend by 15%), TOL +1.6%
Companies trading higher in after hours in reaction to news: BLFS +10.5% (to join S&P SmallCap 600), MIME +7.1% (to join S&P MidCap 400), OPCH +6.9% (to join S&P MidCap 400), TRMK +4.5% (to move to S&P SmallCap 600 from S&P MidCap 400), AVT +1.5% (increases dividend), CNK +1.1% (to move to S&P SmallCap 600 from S&P MidCap 400), LMPX +0.8% (to acquire dealership; expected to add $0.12/sh in 2022), HYZN +0.6% (highlights partner Raven SR's announcement of first waste-to-hydrogen hub), XPEV +0.3% (begins shipping first P7 EVs to Norway, according to Electrek), BHLB +0.2% (BHLB and BRO to sell Berkshire Insurance Group to a subsidiary of BRO), TECH +0.1% (to join S&P 500)
After Hours Losers:
Companies trading lower in after hours in reaction to earnings/guidance: LMNR -10.7% (guides JulQ EPS and revenue below consensus), JWN -7.9%, URBN -3.4%, VNET -2.5%, HEI -1.9%
Companies trading lower in after hours in reaction to news: HUGE -13.4% (to terminate its Phase 2 clinical trial of FSD-201), SAIA -3.7% (to join S&P MidCap 400), PRPL -1.9% (CFO stepping down), ADMP -1.8% (names new CFO), RIOT -0.6% (files for 11.8 mln share offering by selling shareholder), ALIT -0.3% (stock offering), APO -0.1% (raising $500 mln to create a fund for investing in SPACs, according to Reuters)
Crypto Cummings is back
More blockchain bunkum from the bloke who brought us Brexit, BarnardCastleGate and (arguably) Boris.
Closing Stock Market SummaryThe S&P 500 (+0.2%) and Nasdaq Composite (+0.5%) rose modestly on Tuesday, setting intraday and closing record highs in a tame session. The Nasdaq topped the 15,000 level for the first time ever while the S&P 500 flirted with the 4,500 level.
The Dow Jones Industrial Average increased just 0.1%. The Russell 2000 outperformed its large-cap peers with a 1.0% gain.
Risk sentiment seemed to draw support from several factors, including upbeat earnings news, better-than-expected new home sales data for July, decent rebound gains in Chinese technology stocks, and yesterday's reports that the Delta variant could be peaking in the U.S.
Despite the relative strength of the Nasdaq, there was a pro-cyclical disposition: The S&P 500 energy (+1.6%), consumer discretionary (+0.8%), materials (+0.7%), financials (+0.7%), and industrials (+0.5%) sectors finished atop the sector standings. Energy stocks derived their strength from the continued rebound in oil prices ($67.50, +1.90, +2.9%)
Conversely, the consumer staples (-0.8%), real estate (-0.7%), utilities (-0.6%), and health care (-0.3%) sectors closed lower for the second straight day. The information technology sector (-0.1%) was pinned down by softness in Apple (AAPL 149.62, -0.09, -0.1%) and Microsoft (MSFT 302.62, -2.03, -0.7%).
The underperformance of the defensive-oriented sectors coincided with increased risk-taking activity. For example, shares of GameStop (GME 210.29, +45.40, +27.5%) and AMC Entertainment (AMC 44.26, +7.48, +20.3%) rose more than 20.0% in the afternoon on no specific news.
Separately, Best Buy (BBY 121.49, +9.33, +8.3%), Palo Alto Networks (PANW 441.87, +69.30, +18.6%), and Medtronic (MDT 132.57, +4.09, +3.2%) were some of the earnings-related gainers. Alibaba (BABA 171.70, +10.64, +6.6%) and JD.com (JD 75.22, +9.49, +14.4%) were two Chinese stocks that saw some much-needed relief.
Unlike yesterday, longer-dated Treasury yields increased in sympathy with the cyclical bias. The 10-yr yield rose four basis points to 1.29% while the 2-yr yield slipped one basis point to 0.22% following a strong $60 bln 2-yr note auction. The U.S. Dollar Index decreased 0.2% to 92.88.
Reviewing Tuesday's economic data:
- New home sales increased 1.0% month-over-month in July to a seasonally adjusted annual rate of 708,000 (consensus 700,000) from an upwardly revised 701,000 (from 676,000) in June. On a yr/yr basis, which encompasses a tough pandemic comparison period, new home sales were down 27.2%.
- In economic data:
- The key takeaway from the report is that new home sales, which are counted when contracts are signed, are being squeezed by cost constraints that are making it less enticing for builders to build lower-priced homes and by affordability pressures that are making it more challenging for prospective buyers to buy higher-priced homes.
Looking ahead, investors will receive Durable Goods Orders for July and the weekly MBA Mortgage Applications Index on Wednesday.
- S&P 500 +19.4% YTD
- Nasdaq Composite +16.5% YTD
- Dow Jones Industrial Average +15.6% YTD
- Russell 2000 +13.0% YTD
Regulators reject suspicions of insider trading in Aston Martin and Daimler shares
BaFin and FCA find no evidence of wrongdoing after looking into dealing, including by Mercedes F1 boss
Financial regulators have looked into suspicions of insider trading in Daimler and Aston Martin shares, including the purchase of a stake in the UK luxury carmaker by Toto Wolff, Mercedes’s Formula One boss.
BaFin, the German markets watchdog, said it had looked into trading at Daimler and also passed information to counterparts at the UK’s Financial Conduct Authority regarding trading in Aston Martin shares.
BaFin said it had not found evidence to proceed with an investigation. The FCA declined to comment. A person familiar with the matter said the FCA had not pursued an investigation.
Some of the regulatory actions were first reported by Canadian newspaper Le Journal de Montréal.
Wolff, who owns about a third of the Mercedes team, which has won the F1 motor racing championships for seven consecutive seasons, bought shares in Aston Martin in April 2020.
Daimler, the Frankfurt-listed parent company of Mercedes, also owns a minority stake in Aston Martin.
Wolff purchased a 0.95 per cent stake in Aston Martin from a vehicle controlled by Lawrence Stroll, the UK carmaker’s executive chair.
The following month, Aston Martin appointed Tobias Moers, the former head of Mercedes’ high-performance AMG business, as its chief executive. In late October, Daimler said it would increase its stake in Aston Martin to 20 per cent from less than 5 per cent. Daimler has owned Aston Martin shares since 2013.
Mercedes F1 said Wolff had not been aware of either plan when he acquired the shares and that “all relevant disclosures were made to the UK financial authorities at the appropriate time”. Wolff did not acquire or trade any Daimler shares or securities last year, Mercedes said.
Aston Martin shares have increased by more than two-thirds to £19.62 each since April 17 last year, giving it a value by market capitalisation of more than £2.2bn. Wolff’s stake is now worth £13.9m, according to S&P Global Intelligence.
Aston Martin, the carmaker, is separate to the F1 team that bears its name. Canadian billionaire Stroll owns Aston Martin F1 and led a consortium that rescued the carmaker last year. Mercedes supplies engines and gearboxes to the Aston Martin F1 team.
Daimler is set to reduce its shareholding in the Mercedes F1 team to a third later this year, following a deal under which Ineos, Jim Ratcliffe’s petrochemicals company, will acquire a third of the racing outfit.
Forget The Fed And Jackson Hole: Treasury Is About To Unleash $500 Billion Quantitative Tightening
Three weeks ago, moments after the Treasury released its latest Treasury issuance Sources and Uses report which virtually nobody on Wall Street pays attention to, we confirmed something we first observed months earlier: stealth QE - which as we explained early this year is how the Treasury injected $1.5 trillion of liquidity into the market in the past 12 months bypassing the Fed entirely - was not only over but was about to go into reverse as the US Treasury was set to unleash several hundred billion of quantitative tightening.
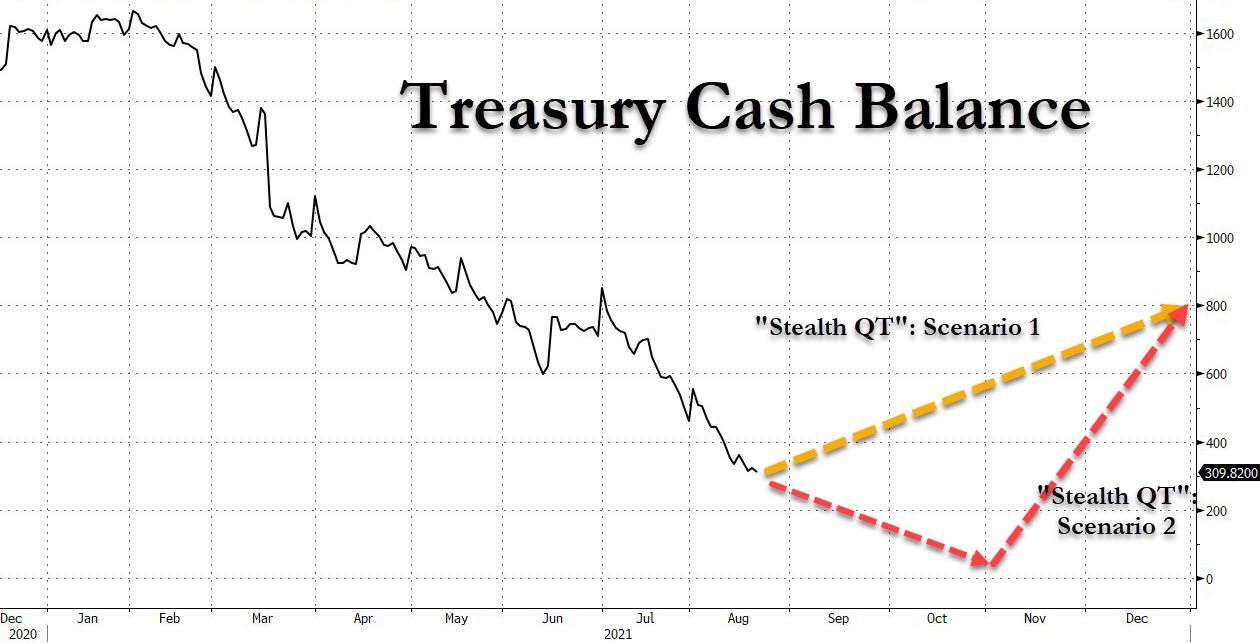
The reason: after dropping to a post-covid low of $450 billion, the Treasury's cash balance would first drop to $300 billion, and then continue declining for the duration of the debt ceiling negotiations (which will conclude successfully at some point in the next 2 months despite days of theatrical posturing as the US will not default) before surging to $800 billion by year end.
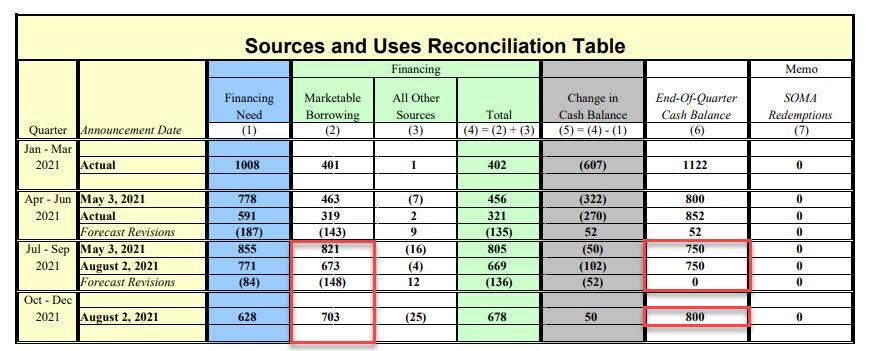
To be sure, the specifics of the upcoming Quantitative Tightening are still in flux and depend on when the US debt ceiling (which as a reminder was hit on July 31) and will be raised or extended: for all intents and purposes this is expected to take place some time "in October or November" which is when the debt limit deadline hits according to the CBO (that's when the various emergency measures to extend the debt ceiling expire).
But while some last minute fireworks are assured, absent a compete collapse in the political process we expect another can-kicking extension in the debt ceiling some time in October or early November. To be sure, that means that the Treasury's benign Sept 30 forecast of $750BN will not be met and instead Treasury cash levels will continue to shrink from current levels until there is some resolution.
Which brings us to another question: what are current cash levels at the Treasury? Well, after rising as high as $1.8 trillion last July, the cash held at the Treasury General Account has plunged to just $309 billion, the lowest level since the covid pandemic. This is largely due to the borrowing cap which has prompted the government to cut bill issuance and draw down its cash pile, while also putting tremendous downward pressure on short-term rates, pushing repo rates into negative territory, and breaching the Fed's reverse repo 0.05% "floor" level as both Bills and overnight GC repo now trade below this level as discussed yesterday.
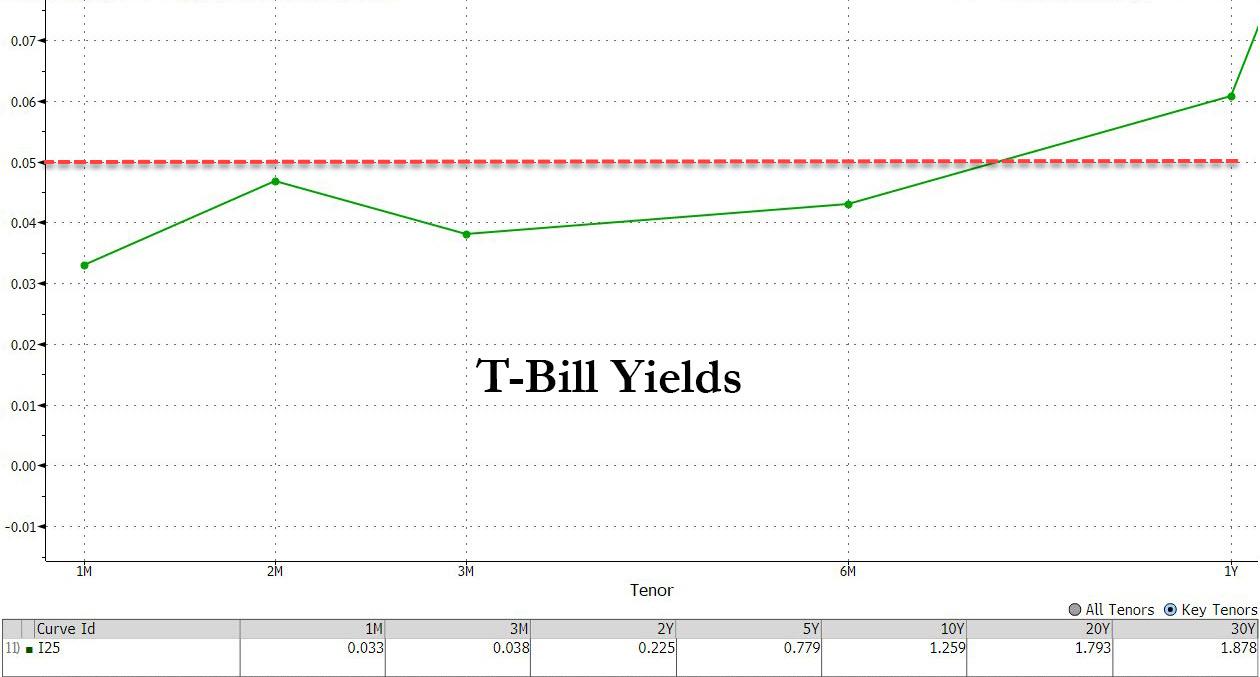
This means also that in the past 14 months, the Treasury - completely independent of the Fed - has injected a massive $1.5 trillion in liquidity into the market while soaking up massive amount of collateral, and is one of the reasons why today's reverse repo print will be a record $1.2 trillion (on its way to $2 trillion or more by year end).

But now comes the reversal, and with Treasury cash dropping to its pre-covid levels the next move is higher, and sharply so once the debt ceiling is resolved.
Why do we bring this up? Because while most ignore this analyses when we posted it first in May and then again in early August, the financial experts are starting to wake up to the fact that the Treasury's Quantitative Tightening is going to be a far greater factor for market liquidity in the near term than what happens at Jackson Hole.
First, an aside on Friday's main event: as we have discussed ad nauseam, at 10am on Friday Powell may unveil that the Fed will begin tapering in September... or he may not. As Goldman noted yesterday, "there is a 45% chance that the formal announcement will come in November, a 35% chance that it will come in December, and 20%chance that it will be delayed until 2022." The bank also said it expects the Fed to "taper at a pace of $15bn per meeting, split between $10bn in UST and $5bn in MBS."
Bottom line: whether Powell reveals the taper or he doesn't, the reality is that QE will still be with us for a long, long time even if the Fed starts shrinking its purchases in Q1 of next year, as the next Goldman chart shows.

But while the Fed's tapering just means QE will still persist until mid- to late-2022, it is the Treasury's QT that will be a far greater swing factor for market liquidity, especially once the debt ceiling is resolved and the Treasury starts draining liquidity at a furious pace by issuing debt - primarily in the form of Bills.
Why do we bring all of this up?
Because after ignoring the Treasury's upcoming stealth QT, for months, Wall Street has finally woken up to the real threat to risk assets and as Bloomberg writes this morning, "Man Group last week wrote that because this implies the Treasury will be issuing more than spending, it’s effectively a form of quantitative tightening" just as we said in early August.
This, according to Man Group "could prompt investors to start cutting their rates positions eventually, though there’s usually a six-week lag between changes in the Treasury cash pile and the impact on longer-dated bond yields." And since stocks, especially high duration tech names trade as a treasury proxy, once the selling in rates begins, it will quickly spillover to the FAAMGs which just happen to be the handful of generals propping up the entire market.
Below we republish the Man note, which while covering a topic we have discussed extensively, is something to keep an eye on as we believe many more traders will soon realize that Jackson Hole - and the taper in general - is just a distraction from the far greater QT coming up at the hands of the US Treasury which is about to unleash a massive Quantitative Tightening in the coming months, draining a whopping $500 billion in liquidity by year-end - assuming there is no further drain in Treasury cash which however is unlikely - and potentially as much as $800 billion should the Treasury cash drop to approximately $0 by November as the debt ceiling negotiations extend until the last possible moment, at which point the Treasury scrambles to refill its cash balance with a flood of Bill issuance
From Man Group
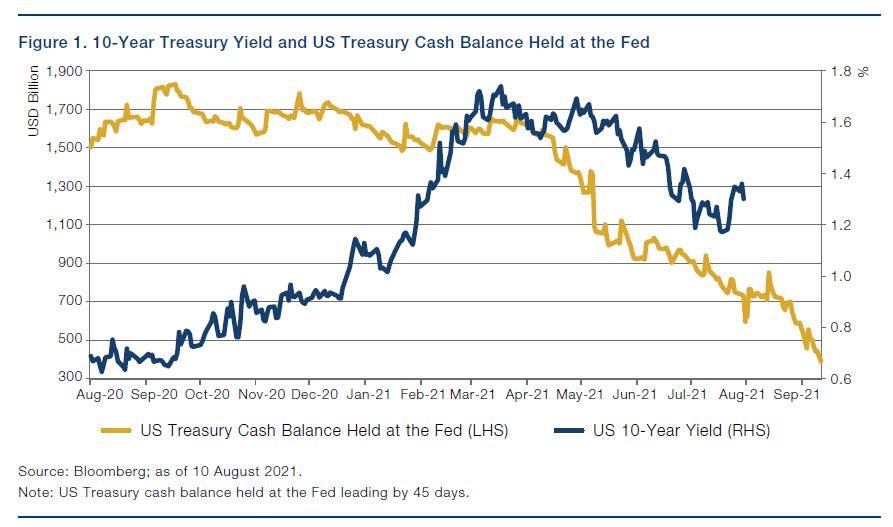
Do Treasury Cash Levels Imply Quantitative Tightening?At the time of writing, it’s all but certain that Congress is unlikely to raise the US debt ceiling before the Senate leaves for summer recess. The debt ceiling is the maximum amount the US government can borrow to meet its financial obligations. When the ceiling is reached, the Treasury cannot issue any more bills, bonds, or notes. It can only pay bills through tax revenues, or by dipping into its savings (i.e., the cash balance) at the Treasury.At the end of July, the Treasury’s cash balance was only USD442 billion, a relatively low level. For context, between the end of June and end of July, the cash balance fell by USD398 billion [ZH: it has since dropped to $309 billion]In a ‘normal’ world (where the debt ceiling isn’t an issue), the US Treasury would not have tapped into its cash balance. Instead, it would have issued enough debt to match its spending needs. Net net, this would have no impact on markets – the amount the Treasury spends (which is like a cash injection into the US economy) would be offset by the amount of debt issuance (this would take liquidity out of the system as investors would be using their cash to buy US Treasury instruments).However, in the last few months, the US Treasury has slowed down issuance because of the debt ceiling. This, in turn, has forced the Treasury to tap into their ‘rainy day’ fund and deplete its cash balance. Because it hasn’t done much issuance to take out liquidity, net net, these actions by the US Treasury have acted like substantial quantitative easing (i.e., cash injection without the offsetting liquidity withdrawal from issuance).Separately, the Treasury has indicated that once the debt ceiling is increased, it plans to run the cash balance at USD750 billion. This would imply that the Treasury is taking more out of the system via issuance than it is putting back into the system via spending, because it is replenishing its rainy-day fund. This acts like quantitative tightening.In addition, there is a roughly 6-week lag between changes in the Treasury cash account and the impact on longer-dated Treasury yields (Figure 1). As such, it is possible that Treasury yields may fall further or remain at the current low levels for another six weeks or so.If private sector market participants still have any ability to anticipate future developments, then we are likely near the point where investors begin to reduce their rates positions to make room for the increased issuance that would take place the moment the debt ceiling rollover happens. In due time, this should have an impact on asset prices that depend on long-term yields.
>>> Up
* Bank of Georgia Group Raised to Buy at Peel Hunt; PT 1,967 pence
* Neste Raised to Outperform at RBC; PT 62 euros (+)
>>> Down
* EQS Group Cut to Hold at GSC Research; PT 48.50 euros (+)
* Hufvudstaden Cut to Hold at SEB Equities; PT 165 kronor
* NCC Cut to Hold at Canaccord; PT 340 pence (+)
* Shurgard Cut to Neutral at JPMorgan; PT 46 euros (+)
>>> Initiate
* Deepmatter Rated New Speculative Buy at Canaccord; PT 3.30 pence (+)
* MaxCyte Rated New Buy at Stifel; PT 1,310.23 pence
* Novem Group Rated New Buy at Berenberg; PT 28 euros
* Novem Group Rated New Hold at Jefferies; PT 19.50 euros
>>> Call
* Citi Retains Buy Ratings on Naspers and Prosus After Share Swap (+)
* Coats Gets Buy, Street-High PT at Jefferies on ‘Severe’ Discount
* Dermapharm Profitability High On Immune System Drugs: Jefferies (+)
* NCC Group Slides as Canaccord Downgrades to Hold on Valuation (+)
* Neste Upgraded at RBC on Long-Term Diversification Opportunity (+)
* Novem Analysts Say Growth Outlook Strong as Ratings Initiated
Intel Lands Pentagon Deal to Support Domestic Chip Making
Department of Defense aims to help develop U.S. ecosystem to fabricate products required for critical systems
Intel Corp. INTC 2.35% said it would provide commercial foundry services in the first phase of a broader Defense Department program that aims to build up domestic design and production of cutting-edge chips.
The chip maker on Monday said its foundry services unit will join with companies such as International Business Machines Corp. , Synopsys Inc., Cadence Design Systems Inc. and others as part of the RAMP-C program, which is short for Rapid Assured Microelectronics Prototypes - Commercial.
The program was designed to support a U.S.-based, chip-building ecosystem that could give the government agency access to technology and help secure its long-term needs for products, Intel said. The National Security Technology Accelerator, a nonprofit consortium that works with the Defense Department, didn’t respond to requests for comment about contract details.
Intel’s entry into the program comes as the U.S. government has been working to address a global semiconductor shortage. The Biden administration’s defense budget for the 2022 fiscal year includes a request for $2.3 billion for microelectronics efforts deemed critical to long-term national security.
The contract award will support Intel Foundry Services, which the company established as a stand-alone division earlier this year to produce Intel-design chips and those using other architectures.
Intel has laid out a plan to invest about $20 billion in building out two new factories in Arizona. It said the factories will provide capacity for foundry customers and support what it sees as expanding requirements for Intel products. Intel said it expects to start planning and construction activities this year.
Intel Chief Executive Pat Gelsinger and other board members met last month with members of the Biden administration to discuss plans to build more chip factories and make a case for receiving government subsidies to advance those efforts, The Wall Street Journal reported.
Chip production over the past few decades has shifted away from the U.S. and Europe—which had previously been the center—in part because of financial incentives provided by governments to build up domestic industries.
Chip-industry officials expect the shortage that has led to cuts in car production and driven up prices of some consumer electronics to ease in the coming months, with some effects likely to be felt for a long time.
The pandemic has increased spending on items from laptops to data centers used for computing services that businesses and consumers increasingly rely on. That has contributed to the chip-supply bottleneck, but also provided some benefits to chip suppliers, industry officials have said.
Mr. Gelsinger, who rejoined Intel as CEO in February, has worked to refashion Intel’s image as an innovator despite the company’s past missteps. He has also said the company is committed to buying other chip makers as the industry consolidates. The company had been in talks to buy GlobalFoundries, though those discussions have since cooled, the Journal previously reported.
Intel lost its title last year as the nation’s largest semiconductor company by market value to Nvidia Corp. South Korea’s Samsung Electronics Co. became the world’s top chip maker by revenue in the second quarter.
Since Mr. Gelsinger became CEO, Intel’s share price is down about 14% through Monday’s close, compared with a 14% gain in the S&P 500.