October Has Always Been The Wildest Month For The Stock Market
Anyone who follows the mainstream financial press is seeing an increasing number of articles about bear market risk. Wednesday's Bloomberg guest piece by Barry Ritholtz is a classic example: Signs of a Bull Market Turning Bear.
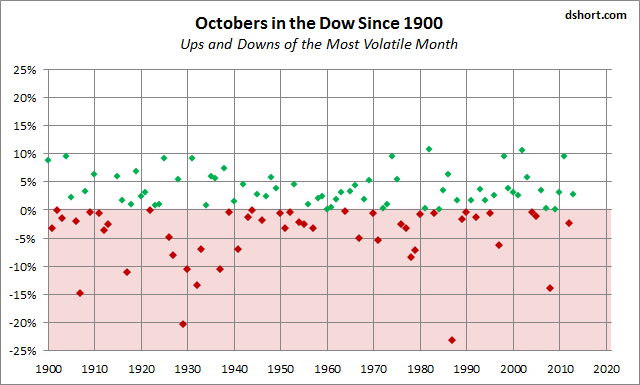
The growth in investor anxiety is happening in October, historically the most volatile month for market performance. I took a few minutes to update a couple of charts to illustrate October volatility using the Dow and starting in 1900. So we can see 114 October gains and losses.
Here is a look at the data in a chronological sequence.
Here are the same percentages sorted from low to high.

As we can see, the Dow October average over this timeframe is a modest 0.20%. There have been 64 monthly gains and 49 monthly losses. That's calculates as a gain about 57% of the time. Note that the outbreak of WWW I in 1914 prompted the closure of US markets from July 31 to November 28.
But the range is truly remarkable, from the 10.65% surge in 1982 to the -23.22% rout in 1987, which included the -22.61% cliff-dive on October 19th, known as Black Monday.
As I type this, the October Dow is down 1.67%, the S&P 500 is down 1.77% and the Russell 2000 is down 2.68%.
Time will tell!
Read more: http://www.businessinsider.com/historical-october-stock-market-data-2014-10#ixzz3G61Cp0rF