AT&T Again Exploring a Deal for DirecTV
Telephone giant in discussions with private-equity bidders for satellite-TV business wounded by shift to streaming services
AT&T Inc. T 0.47% is taking a fresh look at its DirecTV business, according to people familiar with the matter, exploring a deal for a service wounded by cord-cutting.
The telecom and media giant and its advisers at Goldman Sachs Group Inc. GS -1.16% have been in talks with private-equity suitors about the satellite TV unit, some of the people said. Potential bidders include Apollo Global Management Inc., APO -1.50% which had expressed interest last year, and Platinum Equity, these people said.
The process is at an early stage, and it’s not clear what form any deal would take—or if there will be one at all. It is possible some of the suitors will team up or submit joint proposals. Other investors that were approached have decided not to pursue bids, some of the people said.
AT&T executives have previously explored parting with DirecTV assets, including a potential spinoff or combining assets with rival Dish Network Corp., DISH 0.32% but obstacles, including antitrust concerns, have gotten in the way.
Any deal for the satellite TV service would be sizable, but likely a far cry from the $49 billion AT&T paid for it in 2015. The pay-TV unit has lost millions of subscribers in recent years as viewers switch to on-demand entertainment services like Netflix Inc. A deal could value the business below $20 billion, some of the people said.
If a deal is reached, it would start to streamline a company that used a series of acquisitions in the last decade to shift from a phone service provider into a media conglomerate. It also left the enlarged AT&T with roughly $180 billion of net debt.
The purchase of DirecTV made AT&T the biggest U.S. pay-TV provider, a title it later ceded to Comcast Corp. as satellite customers canceled. In 2018, a roughly $80 billion takeover of Time Warner added HBO, the Warner Bros. film studio and cable channels like CNN to AT&T’s portfolio.
The latest deal talks were spurred by Chief Executive John Stankey, an AT&T veteran who took the corner office in July from longtime boss Randall Stephenson, who remains chairman. Mr. Stankey has said the company should sharpen its focus on core connectivity services.
Cellphone service and wired broadband remain AT&T’s biggest profit engines and account for more than half of the company’s over $180 billion of annual revenue. Those telecom units have played a key role stabilizing overall earnings this year as the coronavirus pandemic drained revenue in its satellite arm and in its WarnerMedia division.
AT&T shares have missed out on the stock market’s recent rally. The shares are down more than 20% year-to-date, compared with a roughly 8% advance in the S&P 500 index.
The talks aren’t certain to yield a sale, and the structure of any deal could result in AT&T retaining a stake in DirecTV. The Dallas company has tested market interest in several pieces of its empire only to decide to keep the units in-house. The company recently paused a sale process for its Warner Bros. Interactive Entertainment videogame unit, according to a person familiar with the matter.
Shedding a majority of the shrinking pay-TV business could offer a cash boost, while also triggering a costly write-down for AT&T. Cord-cutting has caused the most damage at AT&T, which shed 7 million U.S. video connections over the past two years. AT&T doesn’t break out revenue or profits for DirecTV.
Executives say the customer-loss trend is exacerbated by the pandemic. Many bars, hotels and airlines that use satellite feeds are operating at diminished capacity—if at all—sapping more of the unit’s revenue.
The company could still retain pay-TV customers if it decides to drop the satellite infrastructure. Executives earlier this year launched a service called AT&T TV, which delivers DirecTV channels over the internet through a cable box that customers install themselves.
“To the extent that we’re able to get those customers engaged with us on those platforms, then we’re in a good place and we’re OK with that,” Mr. Stankey said in a July interview on CNBC. “And if that takes us down a path that says satellite delivery is less important, so be it.”
AT&T also has joined the streaming fray by launching HBO Max in May. About 4.1 million people had activated the new service by the end of June. Earlier this month, WarnerMedia’s new boss ousted several executives, including the head of HBO Max.
Apollo deal makers have long eyed DirecTV as a potential target. The firm last year pitched a three-way deal that would spin some of the division’s hard assets into a new holding company controlled by Apollo, DirecTV and rival Dish, according to documents reviewed by The Wall Street Journal.
Whether Apollo’s new proposal involves a similar structure couldn’t be learned.
Dish Chairman Charlie Ergen has repeatedly called the union of the country’s two major satellite-TV providers “inevitable,” but AT&T executives have highlighted hurdles that would deter such a deal. Antitrust enforcers could block the deal to preserve competition in the market for live TV channels in rural areas, where satellites are often the only option available.
Activist investor Elliott Management Corp. waged a public campaign last year challenging AT&T’s shift toward media and calling on AT&T to consider asset sales. The two sides ultimately reached a truce, with AT&T promising to conduct a strategic review of its portfolio and buy back more stock. Elliott later reduced its stake in the telecom company.
AT&T also pledged to continue trimming the debt it amassed from acquiring DirecTV and Time Warner over the past five years. The company said it had about $152 billion of net debt at the end of June after refinancing at “attractive rates.”
Closing Stock Market SummaryThe S&P 500 gained 0.7% on Friday for its sixth straight record-setting advance. The Nasdaq Composite gained 0.6% to close at a record high, the Dow Jones Industrial Average gained 0.6%, and the Russell 2000 gained 0.9%.
All 11 S&P 500 sectors closed in positive territory, with energy (+1.9%) and materials (+1.1%) rising more than 1.0%. The information technology sector (+1.0%) was next in line, but it was perhaps the most influential gainer today given its top-weighted position in the S&P 500. The health care sector (+0.2%) lagged.
In the tech space, Workday (WDAY 243.88, +27.25, +12.6%), HP Inc. (HPQ 19.85, +1.15, +6.2%), Dell (DELL 66.21, +3.78, +6.1%), and VMware (VMW 146.09, +3.19, +2.2%) stood out as earnings winners. Semiconductor stocks also chipped in a solid outing, evident by the 2.0% increase in the Philadelphia Semiconductor Index.
There was no one specific catalyst today, but investors did receive another batch of better-than-expected economic data that helped broaden out the gains.
For July, personal income increased 0.4% m/m ( consensus -0.2%) and personal spending rose 1.9% m/m (Briefing.com consensus +1.5%). The final University of Michigan Index of Consumer Sentiment for August ticked up to 74.1 ( consensus 72.8) from the preliminary reading of 72.8.
The data provided some fuel for the reopening stocks like casinos, airlines, cruise lines, and hotels. Shares of MGM Resorts (MGM 23.86, +1.05, +4.6%) rose nearly 5%, even as the company announced plans to lay off 18,000 furloughed employees as a result of the pandemic.
U.S. Treasuries finished little changed. The 2-yr yield was flat at 0.15%, and the 10-yr yield declined two basis points to 0.73%. The U.S. Dollar Index fell 0.7% to 92.32. WTI crude futures declined 0.1% to $42.97/bbl. The CBOE Volatility Index declined 6.2% to 22.96 after touching 26.30 at its intraday high.
Reviewing Friday's economic data:
- Personal income increased 0.4% m/m in July (consensus -0.2%), which was much better than expected, and personal spending rose 1.9% m/m (consensus +1.5%), which was also much better than expected. The PCE Price Index and core-PCE Price Index both increased 0.3% m/m and were weaker than expected increases of 0.4% and 0.5%, respectively. That left the PCE Price Index up 1.0% yr/yr, versus 0.9% in June, and the core PCE Price Index up 1.3% yr/yr, versus 1.1% in June.
- The key takeaway from the report is that the income gain was driven by an increase in compensation (+1.3% m/m), which more than offset a 1.7% m/m decrease in personal current transfer receipts. In other words, the income gain was driven by people returning to work as the economy reopened.
- The final University of Michigan Index of Consumer Sentiment for August ticked up to 74.1 (Briefing.com consensus 72.8) from the preliminary reading of 72.8. The final reading for July was 72.5.
- The key takeaway from the report is that consumer sentiment has been slow to rebound and that the incremental improvement seen has been based simply on the view that things couldn't get worse than they were at the depths of the shutdown period.
- The Chicago PMI for August decreased to 51.2 from 51.9 in July.
- Wholesale inventories decreased 0.1% in July following a revised 1.3% decline in June (from -1.4%).
Investors will not receive any notable economic data on Monday.
- Nasdaq Composite +30.4% YTD
- S&P 500 +8.6% YTD
- Dow Jones Industrial Average +0.4% YTD
- Russell 2000 -5.4% YTD
Hedge Funds Start Piling Into "The Big Short 3.0"
Back in June we said that as we had reported previously, with commercial real estate failing to benefit from the record rebound in overall risk since the March lows as a result of a tidal wave of retail bankruptcies, CMBX Series 6 which back in March 2017 was dubbed the "Big Short 2.0" trade due to its substantial exposure to malls which were hurting long before the arrival of the pandemic...
... and especially the BBB- tranche, has been stuck in purgatory, and after surging to 75, is back to where it was in mid-April as investors signal that the worst is yet to come for commercial real estate.
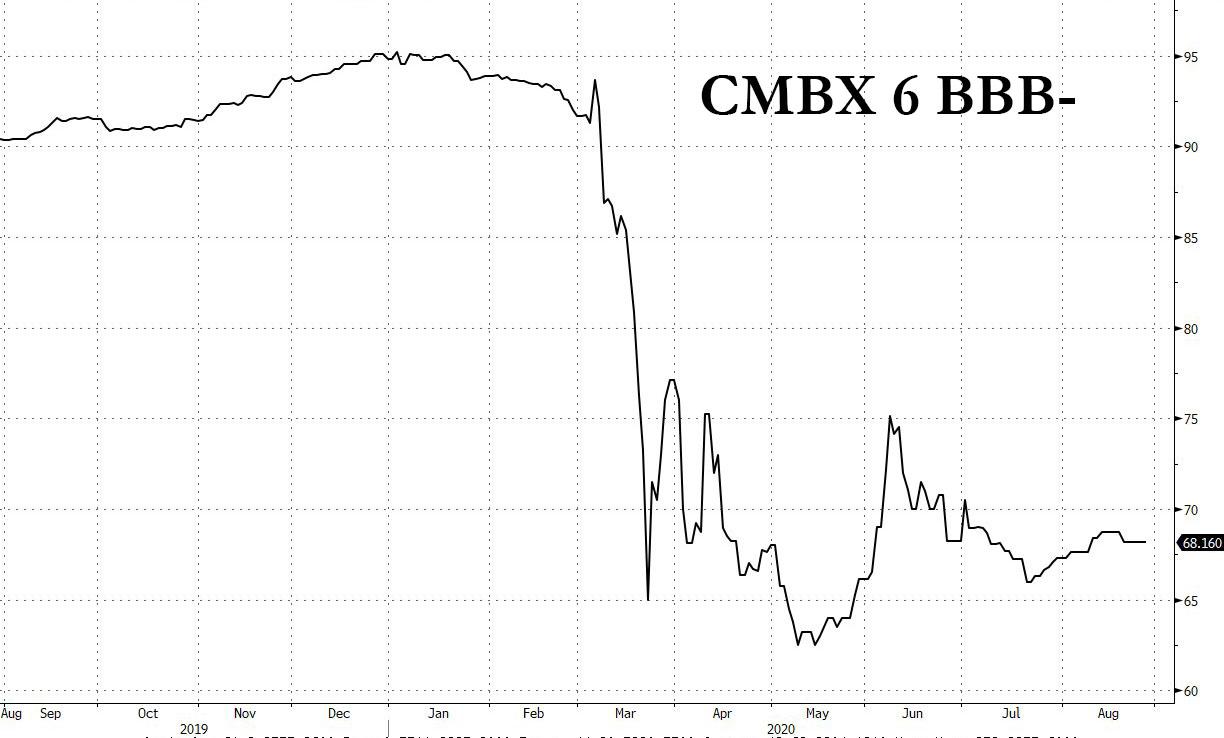
Of course, all of this is well-known by now, and it is safe to say that the riskier tranches of CMBX S6 are now fairly priced for even a downside scenario among retail outlets. But what about other CMBX issues, and is there another "Big Short" lurking among the various tranches, especially in the aftermath of the coronavirus shutdowns which will cripple not just retail outlets but everything from restaurants, to multi-family housing (as city renters flee for the suburbs), to offices and hotels.
As we said all the way back in May, the answer to all those seeking the next Big Short, or Big Short 3.0, is CMBX 9. This is what we wrote:
... with CMBX 6 now done, keep a close eye on CMBX 9. With its outlier exposure to hotels which have quickly emerged as the most impacted sector from the pandemic, this may well be the next big short.
A few weeks later commercial real estate analytics specialist Treppagreed with us. As Trepp's Manus Clancy wrote in a blog post, "the COVID-related volatility over the last three months has resulted in growing interest over CMBX as a way to take positions on US commercial real estate. This week we are back to hone in on CMBX 9."
Below are some of the reasons why CMBX 9 - which so far is off-limits to the Fed's blatant bailouts of most, but not all, asset classes - may be the cleanest and safest way to bet on the devastation resulting from the coronavirus pandemic. Courtesy of Trepp:
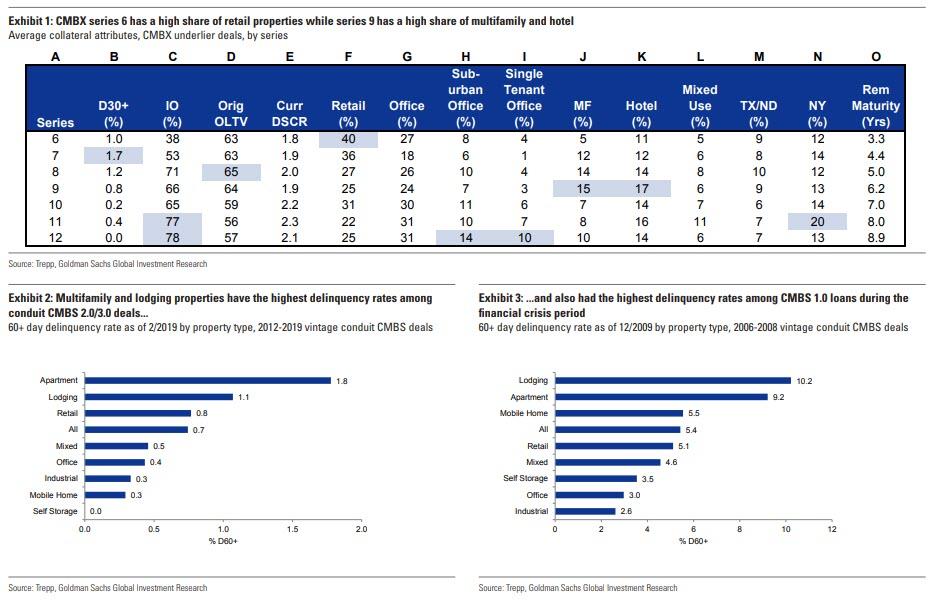
What Makes CMBX 9 Unique?For one, it's the only CMBX index backed by 2015 deals. Before the COVID-19 crisis began, the last meaningful hiccup in CMBS lending came in early 2016. In late 2015, volatility in the US equity markets picked up considerably and oil prices fell to under $30 a barrel. The sharp price decline in black gold led investors to fear a wave of forthcoming bankruptcies from energy companies.That fear led to a sharp repricing of credit in the leveraged loan market and that widening had a gravitational pull on CMBS, dragging spreads wider over the course of two months. That widening in CMBS led to an abrupt pause to CMBS lending leading to a standstill in issuance in Q1 2016.The 2015 CMBX 9 reference obligations consist of deals issued before any of that drama emerged. (The 2016 oil downturn in CMBS also led to several defaults of hotel and multifamily loans backed by "man-camps" in the shale regions of North Dakota and elsewhere.)Other Attributes of CMBX 9?It has the highest concentration of multifamily loans of any CMBX series with 14.7%. (The only other series that is close is CMBX 13 with 14.1%.)CMBX 9 also has the highest concentration of hotel loans with 16.7%. (CMBX 11 is next with 13.8%.) In terms of protection premiums, CMBX 9 BBB- costs about 725 basis points to insure. That's well inside of the 925 basis points for CMBX 8 BBB- but wider than the 675 for CMBX 10 BBB-. (Those spread levels are from IHS Markit).For comparison purposes, CMBX 9 BBB- ended 2019 with a spread of 310 basis points. So there has been about 400 basis points of widening since the beginning of the year.

Furthermore, as we most recently showed in late June, there was a lot of potential downside for CMBX Series 9 BBB-. In fact, if the hotel world suffers a perfect storm of pent up defaults coupled with waves of covid-related shutdowns which send the hotel industry into another tailspin, the potential downside here could be even greater than for Series 6.
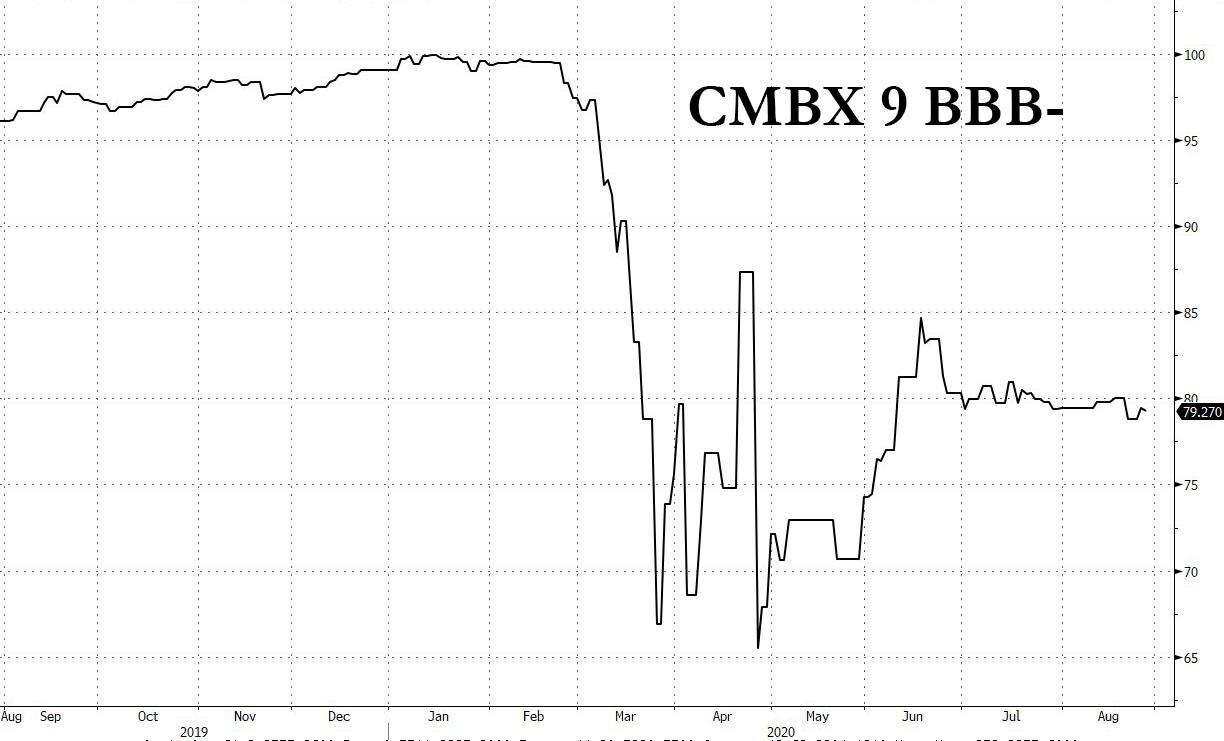
Today, Bloomberg has caught up and writes - three months after us - that hedge funds are "beginning to set their sights on a U.S. credit-derivatives index with outsized exposure to hotel debt as the pandemic sinks the hospitality industry into distress." Actually, they "began" to set their sights in May but who's counting.
The funds, the report goes on, are starting to build up wagers against the synthetic index, known as CMBX 9, "shifting attention from a high-profile bet against America’s challenged malls" i.e., the popular CMBX 6 short first profiled here in 2017 as "The Big Short 2.0" and which made traders such as Carl Icahn $1.3 billion in profit.
The shift, which market participants say is beginning to show up in some trading flows, comes as delinquencies on hospitality property loans surge and even begin to exceed those in retail.
Bloomberg quoted Dan McNamara, a principal at MP Securitized Credit Partners, a hedge fund focused on shorting commercial mortgage bonds and which also made a killing on shorting CMBX 6 (unlike his nemesis Brian Phillips of AllianceBernstein, a famous CMBX 6 bull, who in June lost his job) who said that "in the last month there has been more selling pressure on the CMBX 9 than any of the other CMBS indices. That’s because some hedge funds are actively looking to play the short side on the Series 9 index due to its significant hotel exposure."
Well, seek and ye shall find, as we reported first in May in then and again in June in "Is This The Next Big Short?"
Meanwhile, "funds have been coming out of the CMBX 6 and moving onto the CMBX 9,” said Christopher Sullivan, chief investment officer of United Nations Federal Credit Union. “The CMBX 6 trade has gone a bit long in the tooth and is now more fairly priced given the likely pandemic effects. We can see this series becoming the favorite option now." This is precisely what we said in June.
The question now is how long before CMBX 9 BBB-, which has shown remarkable resilience in recent months, snaps lower. Something tells us it won't be too long: nearly 25% of hotel loans in CMBS are now delinquent, according to Cantor Fitzgerald, compared to about 20% for anchored retail loans. Across the broader CMBS universe, about 10% of hotel loans securitized in bonds are now more than 90 days overdue, compared to only 3.7% for retail loans, Darrell Wheeler, head of research at the New York-based firm, told Bloomberg.
As shown in the chart above above, the fulcrum BBB- tranche of the CMBX 9 series fell to 65.5 cents on the dollar by late April from almost par in early March. It’s since gradually fallen in price to 79 cents on the dollar Thursday from its mid-June peak of about 85 cents.
UNFCU’s Sullivan said CMBX 9 trading volume has been increasing for well over a month, and was among the most actively traded across CMBS indexes for several days in July and August, according to aggregated swap depository data compiled by Bloomberg. Total cumulative trading volume for all tranches of the CMBX 9 increased to $258.5 million on Aug. 26 from $30.2 million on July 28, the data show.
To be sure, the shorts are quietly piling in: for the week ending Aug. 21, the BB tranche of CMBX 9 had $95 million of CDS contracts trading in the market, the highest of any series’ BB tier, according to JPMorgan Chase & Co. data. CMBX 6 had the next greatest amount trading, at $35 million, but that number is declining.
That said, there is always the risk of holding on to a negative carry position for too long before the target "catalyst" - i.e., a price crash - occurs. That’s what happened to some of the earliest proponents of the CMBX 6 short trade such as hedge fund Alder Hill Management, which had been short the CMBX 6 since at least early 2017, and was forced to shutter last year as losses on the wager piled up.
One final note which Bloomberg points out: the CMBX 9 trade doesn’t mature until 2025, while CMBX 6 shorts can get their payouts in 2022. And for short sellers, "CMBX 9 is not as clear cut as CMBX 6, where we expected several BBB- bond classes to take full losses,” Cantor’s Wheeler said.
Liquidity could also be a concern: "It’s not clear whether there will be enough two-way volume in the CMBX 9 index to sustain large bets, said Matt Weinstein, a partner at Axonic Capital, a hedge fund specializing in structured products and commercial real estate. But the thesis makes sense, he said. With one in four hotels in CMBS already in default and revenue per available room still down nearly 50% year-over-year, defaults are likely to pile up as forbearance agreements with lenders roll off."
“From a thematic viewpoint, it makes sense to short hotels,” he said.
Warren Buffett and the $300,000 Haircut
There’s a reason the Oracle of Omaha is an ultrabillionaire as he turns 90: He grasped the power of compounding at the age of 10. The sooner the rest of us fully understand it, the better off we’ll be.
This Sunday, Warren Buffett turns 90.
The chairman of Berkshire Hathaway Inc. BRK.B +0.19% is one of the most successful investors of all time, having amassed a net worth estimated at $82 billion. Yet he accrued nearly 90% of that sum after the age of 65. Investing well is important, but investing well for a long time matters even more.
“I’ve long recommended,” Mr. Buffett told me in an email earlier this month, “what I called ‘The Methuselah Technique.’” That, as he explained in a letter he wrote to the investors in his limited partnership on Jan. 18, 1965, is the combination of a long life and a stable, attractive investment return. Mr. Buffett made his first investment, three shares of Cities Service Co., more than 78 years ago.
“The model seems to be working,” Mr. Buffett quipped in his email, “but I’m only about 9% of the way home.” (At 90, he will be approximately 9% of the age of 969 ascribed to Methuselah in the Bible.)
From the earliest age, Mr. Buffett has understood that building wealth depends not only on how much your money grows, but also on how long it grows.
Around the age of 10, he read a book about how to make $1,000 and intuitively grasped the importance of time. In five years, $1,000 earning 10% would be worth more than $1,600; 10 years of 10% growth would turn it into nearly $2,600; in 25 years, it would amount to more than $10,800; in 50 years, it would compound to almost $117,400.
“That’s where the money is,” he recalls telling himself, according to “The Snowball,” Alice Schroeder’s biography of Mr. Buffett.
“The way that numbers exploded as they grew at a constant rate over time was how a small sum could turn into a fortune,” Ms. Schroeder wrote about his epiphany as a boy. “He could picture the numbers compounding as vividly as the way a snowball grew when he rolled it across the lawn.”
That isn’t easy for most of us to do. People severely underestimate the power of compound growth, and those errors worsen over longer time horizons and for higher rates of return.
Here’s a quick quiz inspired by Warren Buffett. If the Dow Jones Industrial Average, about 28500 this week, compounds at slightly under 1.6% annually, what will its value be on Dec. 31, 2099?
The answer: That would take the Dow to 100,000.
What if the Dow earns an average of 4.6% annually?
That would bring the index to 1,000,000 by the end of the century.
Now imagine that the Dow compounds at 7.7% annually—still below its 8.4% average over the past 30 years. That would push the Dow Jones Industrial Average past 10,000,000 by Dec. 31, 2099.
Those rates of return don’t include any boost from dividends. They also assume an investor takes a diversified approach. Concentrating on only a handful of investments and holding them for years or decades has generated huge gains for Mr. Buffett, but may create nothing but heartache for investors who aren’t as knowledgeable.
If you don’t find those results surprising, you’re either as good at math as Mr. Buffett is, or you have been reading too fast. Even at low to moderate rates of return, long periods of continuous growth turn small amounts into mountains of money. That’s vital for investors to remember when more speculators than ever seem to be hanging on to stocks for only days or hours at a time.
Mr. Buffett’s long career offers another lesson: Be flexible. The older he gets, the less he invests the way he used to.
Mr. Buffett earned his greatest returns decades ago buying the tiniest, cheapest stocks he could find, market microorganisms like water-pump producer Dempster Mill Manufacturing Co. and cartography firm Sanborn Map Co.
Nowadays Berkshire Hathaway’s biggest holding is giant Apple Inc. Mr. Buffett didn’t originally buy it for Berkshire’s portfolio—one of his lieutenants did—but he became more enthusiastic about the investment over time.
This week Mr. Buffett’s company’s stake in Apple was worth about $123 billion, or 24% of Berkshire’s total market value—a stunning turnabout for an investor who long refused to invest in technology stocks because he felt he didn’t understand them.
Across the market overall, Apple’s shares turn over at an annual rate of 211%, estimates AJO, an investment firm in Philadelphia. This means the typical investor holds the stock for less than 25 weeks. Berkshire has held Apple for 4½ years, with no end in sight.
Before he was even a teenager, wrote Ms. Schroeder, his biographer, “Warren began to think about time in a different way. Compounding married the present to the future. If a dollar today was going to be worth 10 some years from now, then in his mind the two were the same.”
By the time he was in his late 20s, the way Mr. Buffett thought about compounding was like a reflex. When he paid $31,500 for his house in Omaha, he called it “Buffett’s Folly,” because “in his mind $31,500 was a million dollars after compounding” into the future, Ms. Schroeder wrote.
His friends and family regularly heard the young Mr. Buffett mutter things like “Do I really want to spend $300,000 for this haircut?” or “I’m not sure I want to blow $500,000 that way” when pondering whether to spend a few bucks. To him, a few dollars spent that day were hundreds of thousands of dollars forgone in the future because they couldn’t compound.
Recognizing that every dollar you spend today is $10 or $100 or $1,000 you won’t have in the future doesn’t have to make you a miser. It teaches you to acknowledge the importance of measuring trade-offs. You should always weigh the need or desire that today’s spending fulfills against what you could accomplish with that money after letting it grow for years or decades into the future. And the more often you trade, the more likely you are to disrupt compounding and to have to start all over again.
Now more than ever, as Mr. Buffett continues to show, patience and endurance are investing superpowers.