Gold to copper: Metals look upward with potential peak greenback
Bloomberg Intelligence December 03, 2018
This analysis is by Bloomberg Intelligence analyst Mike McGlone. It appeared first on the Bloomberg Terminal.
Access the full Bloomberg Commodity Outlook – December 2018 Edition
Metals should be primary beneficiaries of an imminent greenback peak, with normalization in U.S. stock-market outperformance, Federal Reserve tightening near a finish and the trade-weighted broad dollar approaching multiyear highs. Though the dollar tops the list of this year’s best performing major assets, gold and copper show divergent strength. Industrial metals appear to be at a discount in a bull market with favorable demand vs. supply conditions.
Indications from precious metals, notably gold, offer a setup that’s similar to natural gas before its big rally. Bound to historically compressed trading ranges with many typical pressure factors nearing multiyear extremes, precious metals appear close to a maximum loss of faith vs. the strong stock market and greenback.
Aluminum to zinc: Base metals favored vs. unsustainable trends
The primary culprits that often pressure industrial metals prices are near inflection levels of their own, increasing the likelihood of upside potential in base metals, in our view. Copper appears especially difficult to submerge, with its November rebound (absent further dollar gains) offering a sign of recovery.
The primary culprits that often pressure industrial metals prices are near inflection levels of their own, increasing the likelihood of upside potential in base metals, in our view. Copper appears especially difficult to submerge, with its November rebound (absent further dollar gains) offering a sign of recovery.
Base metals decline appears overdone
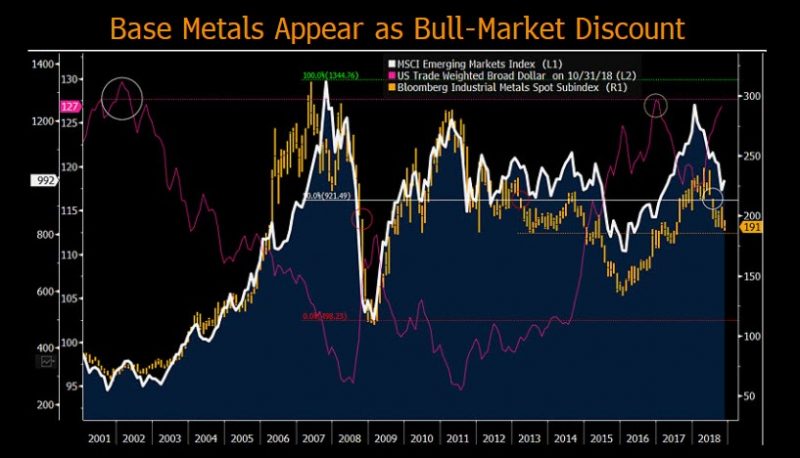
Sustained dollar gains and declines in emerging-market (EM) stocks are what’s needed to keep the industrial metals down. Mean reversion in these trends and a recovery in the metals are more likely, in our view. There’s limited appreciation potential in the trade-weighted broad dollar, which is near its 2016 and 2002 peaks. The metals’ recovery potential appears greater than further downside risks on similar potential for back-and-fill maneuvering in the greenback.
Sustained dollar gains and declines in emerging-market (EM) stocks are what’s needed to keep the industrial metals down. Mean reversion in these trends and a recovery in the metals are more likely, in our view. There’s limited appreciation potential in the trade-weighted broad dollar, which is near its 2016 and 2002 peaks. The metals’ recovery potential appears greater than further downside risks on similar potential for back-and-fill maneuvering in the greenback.
The MSCI Emerging Markets Index and Bloomberg Industrial Metals Spot Subindex are down about 15% in 2018. EM stocks remain above the halfway point of the 2007-09 bear market; metals are below. Since 2000, industrial metals’ annual correlations are 0.86 to EM equities and minus 0.67 to the dollar.
Metals demand vs. supply indicate price discount
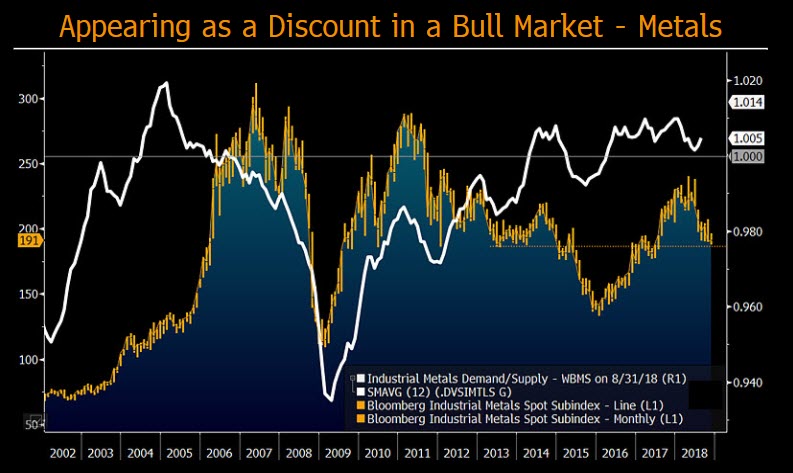
Industrial metals are discounted relative to favorable demand vs. supply. Our analysis of World Bureau of Metal Statistics demand vs. supply datasets for copper, aluminum, nickel and zinc show the ratio improving above par and for the longest period in the database since 1995. The Bloomberg Industrial Metals Spot Subindex’s discount appears unusual. Pricing for what appears to be a worst-case scenario tips the probability in favor of a recovery once the worst fears of a China slowdown and U.S.-trade tensions are alleviated.
Industrial metals are discounted relative to favorable demand vs. supply. Our analysis of World Bureau of Metal Statistics demand vs. supply datasets for copper, aluminum, nickel and zinc show the ratio improving above par and for the longest period in the database since 1995. The Bloomberg Industrial Metals Spot Subindex’s discount appears unusual. Pricing for what appears to be a worst-case scenario tips the probability in favor of a recovery once the worst fears of a China slowdown and U.S.-trade tensions are alleviated.
The subindex indicates what some analysts might describe as an oversold condition. The gauge gapped down in July at a similar level as in 2013. That gap marked the peak in 2014 as metals recovered, then succumbed to plunging crude oil.